Catalyst · A walkthrough in pictures
Ask, refine, review — then share.
Follow one everyday question through generation, a follow-up and a visible correction. See the complete result become a chart, a table and a working dashboard. Then explore our evaluation reports.
From a question to a useful report
This local walkthrough uses OpenMRS HIV demo data. Gemma 4 12B writes the queries and Qwen 2.5 14B reviews them, with no manual SQL edits. The gender follow-up initially double-counted results; the reviewer missed it. A plain-language correction restores the original 2,656 before anything is saved. The opening pipeline screen is the OpenELIS reference; it does not show a new HIV ingestion run.
Prepare source data for analysis
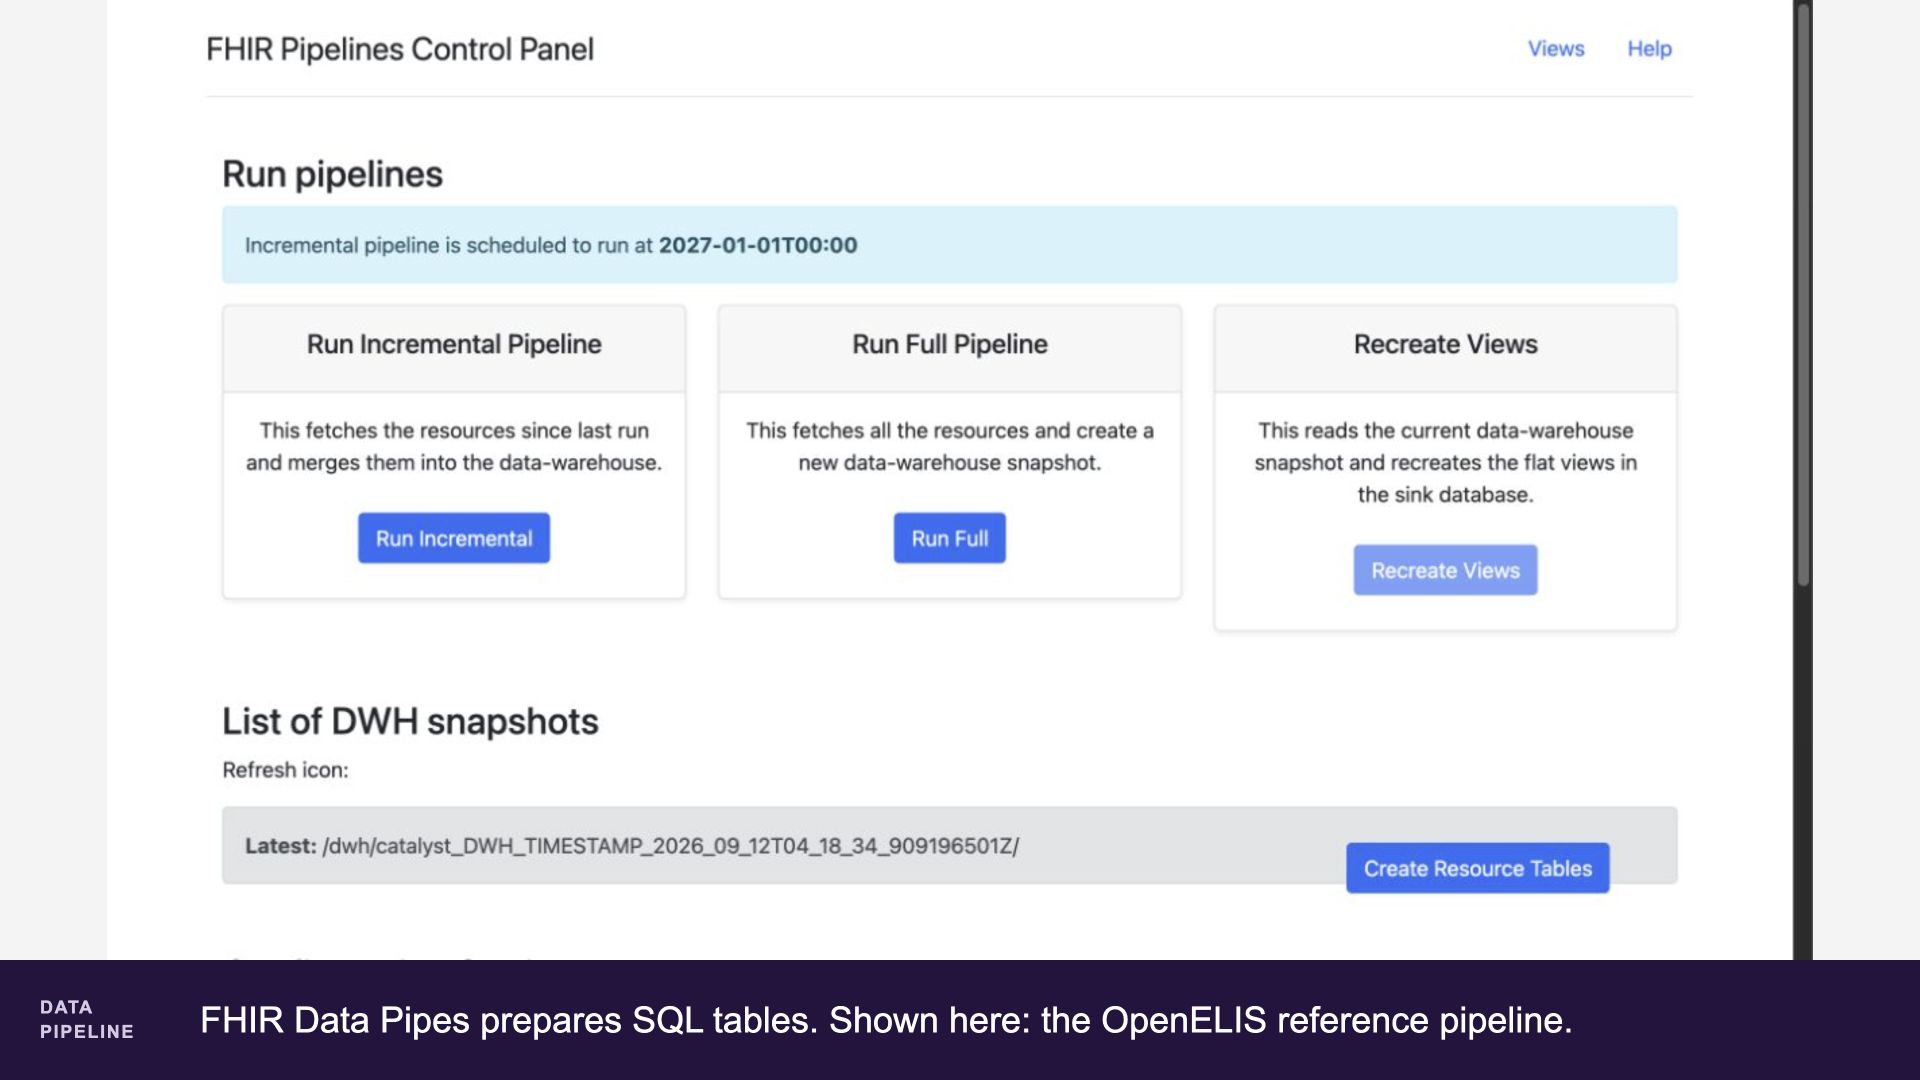
FHIR Data Pipes prepares SQL tables. Shown here: the OpenELIS reference pipeline.
Start with a question in ordinary language
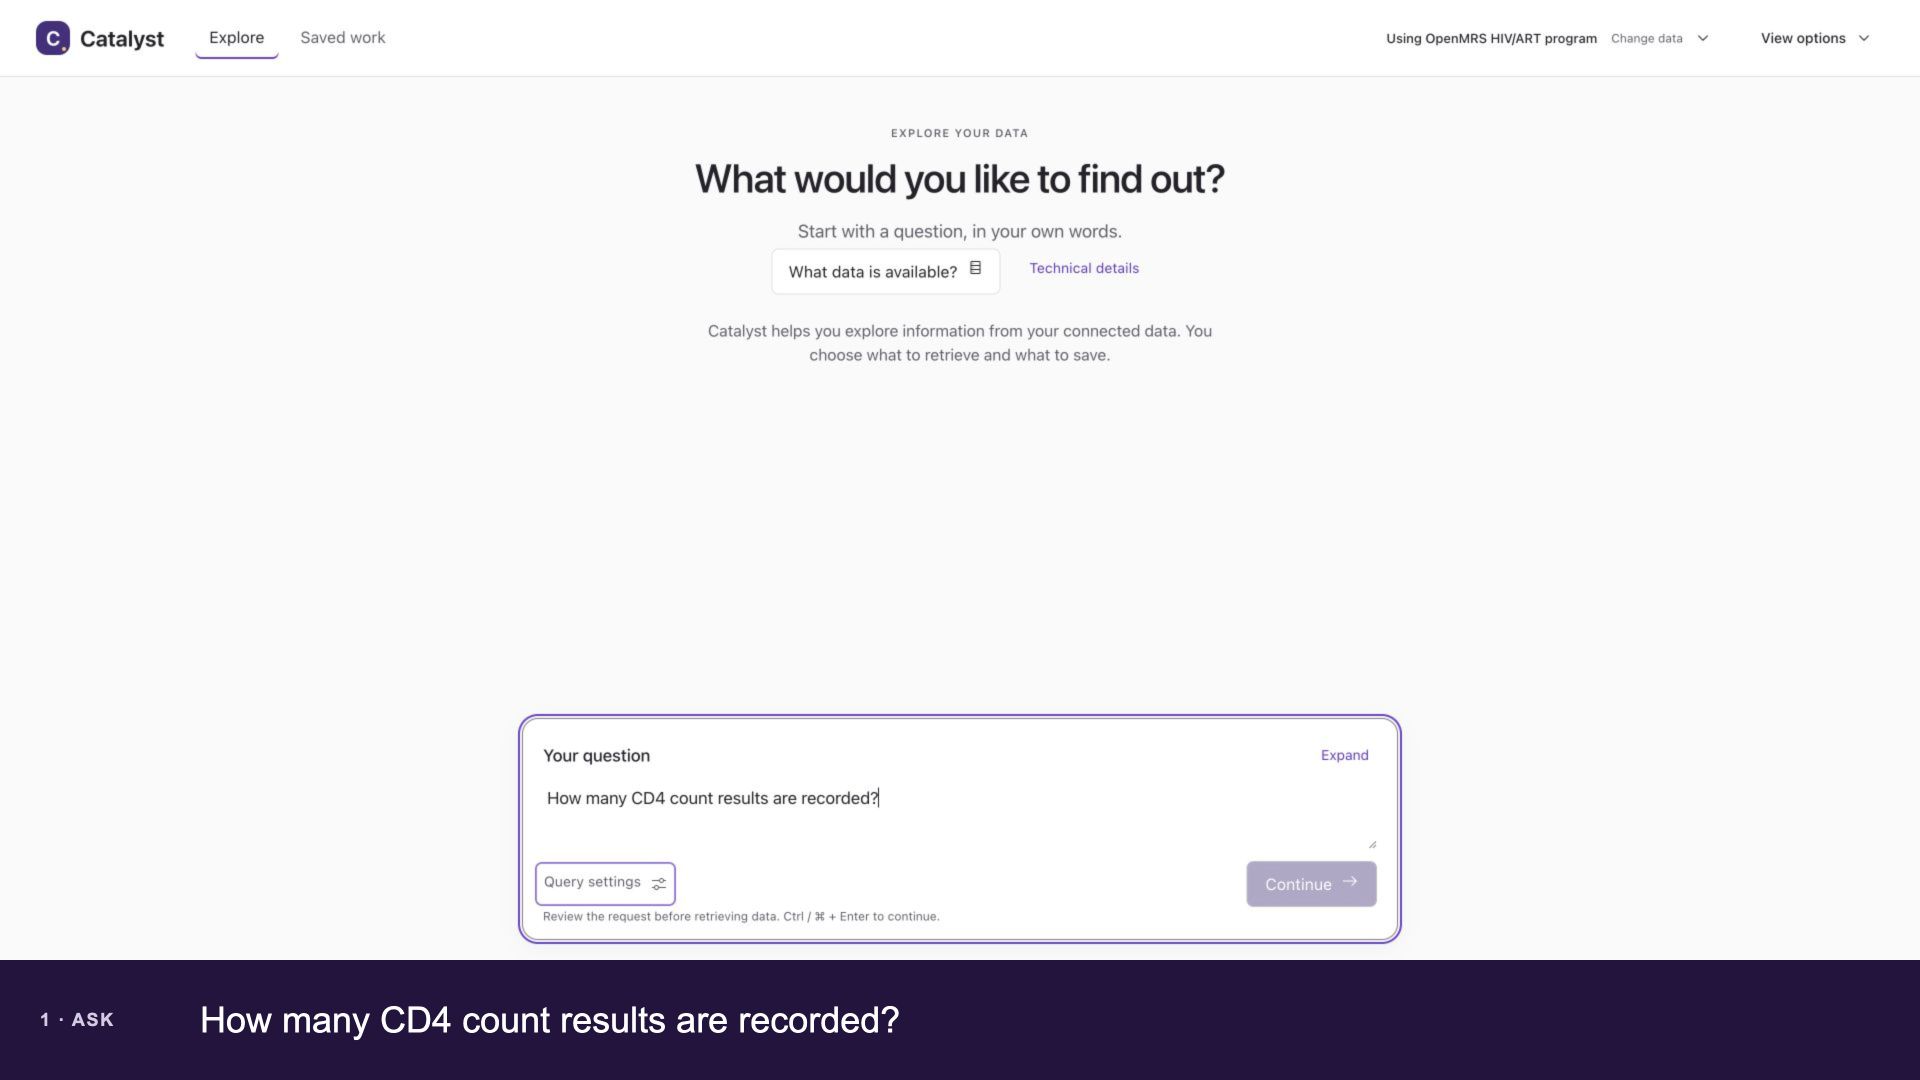
How many CD4 count results are recorded?
Let the models prepare and review the query
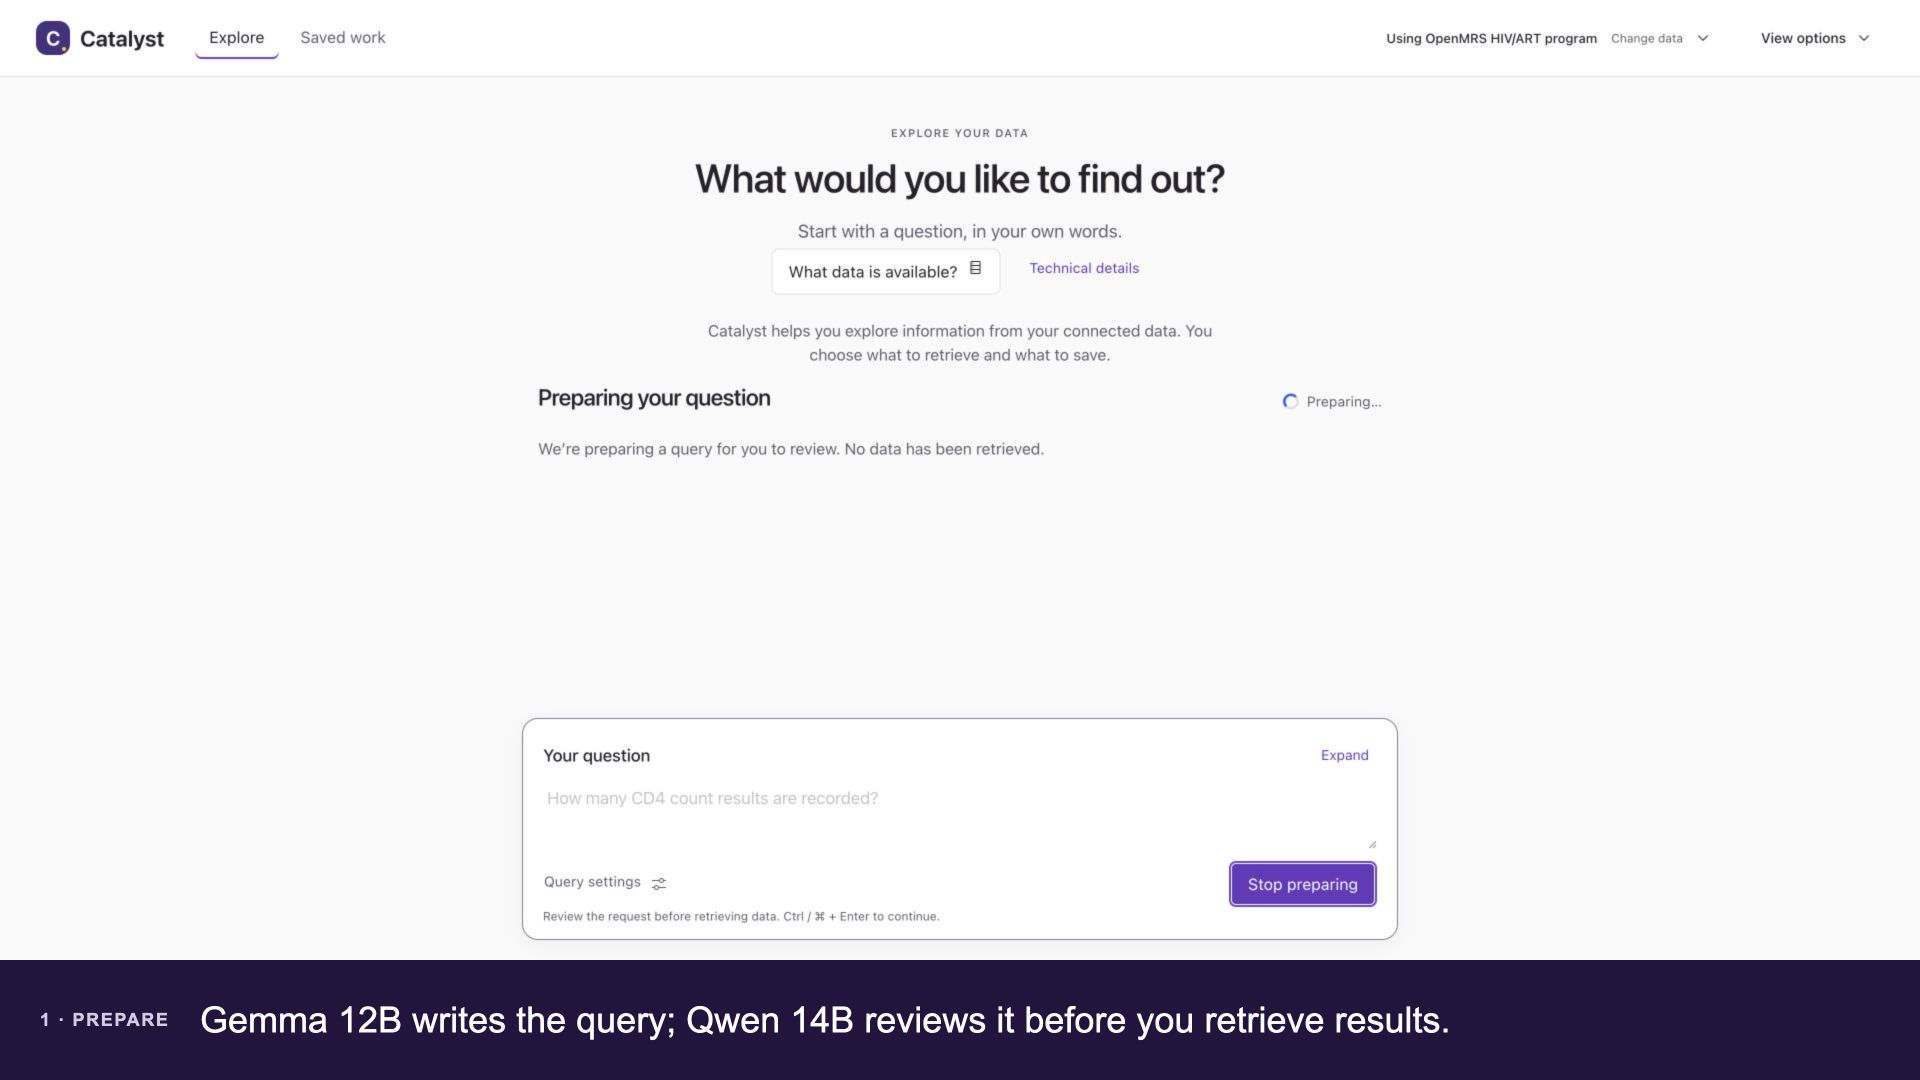
Gemma 12B writes the query; Qwen 14B reviews it before you retrieve results.
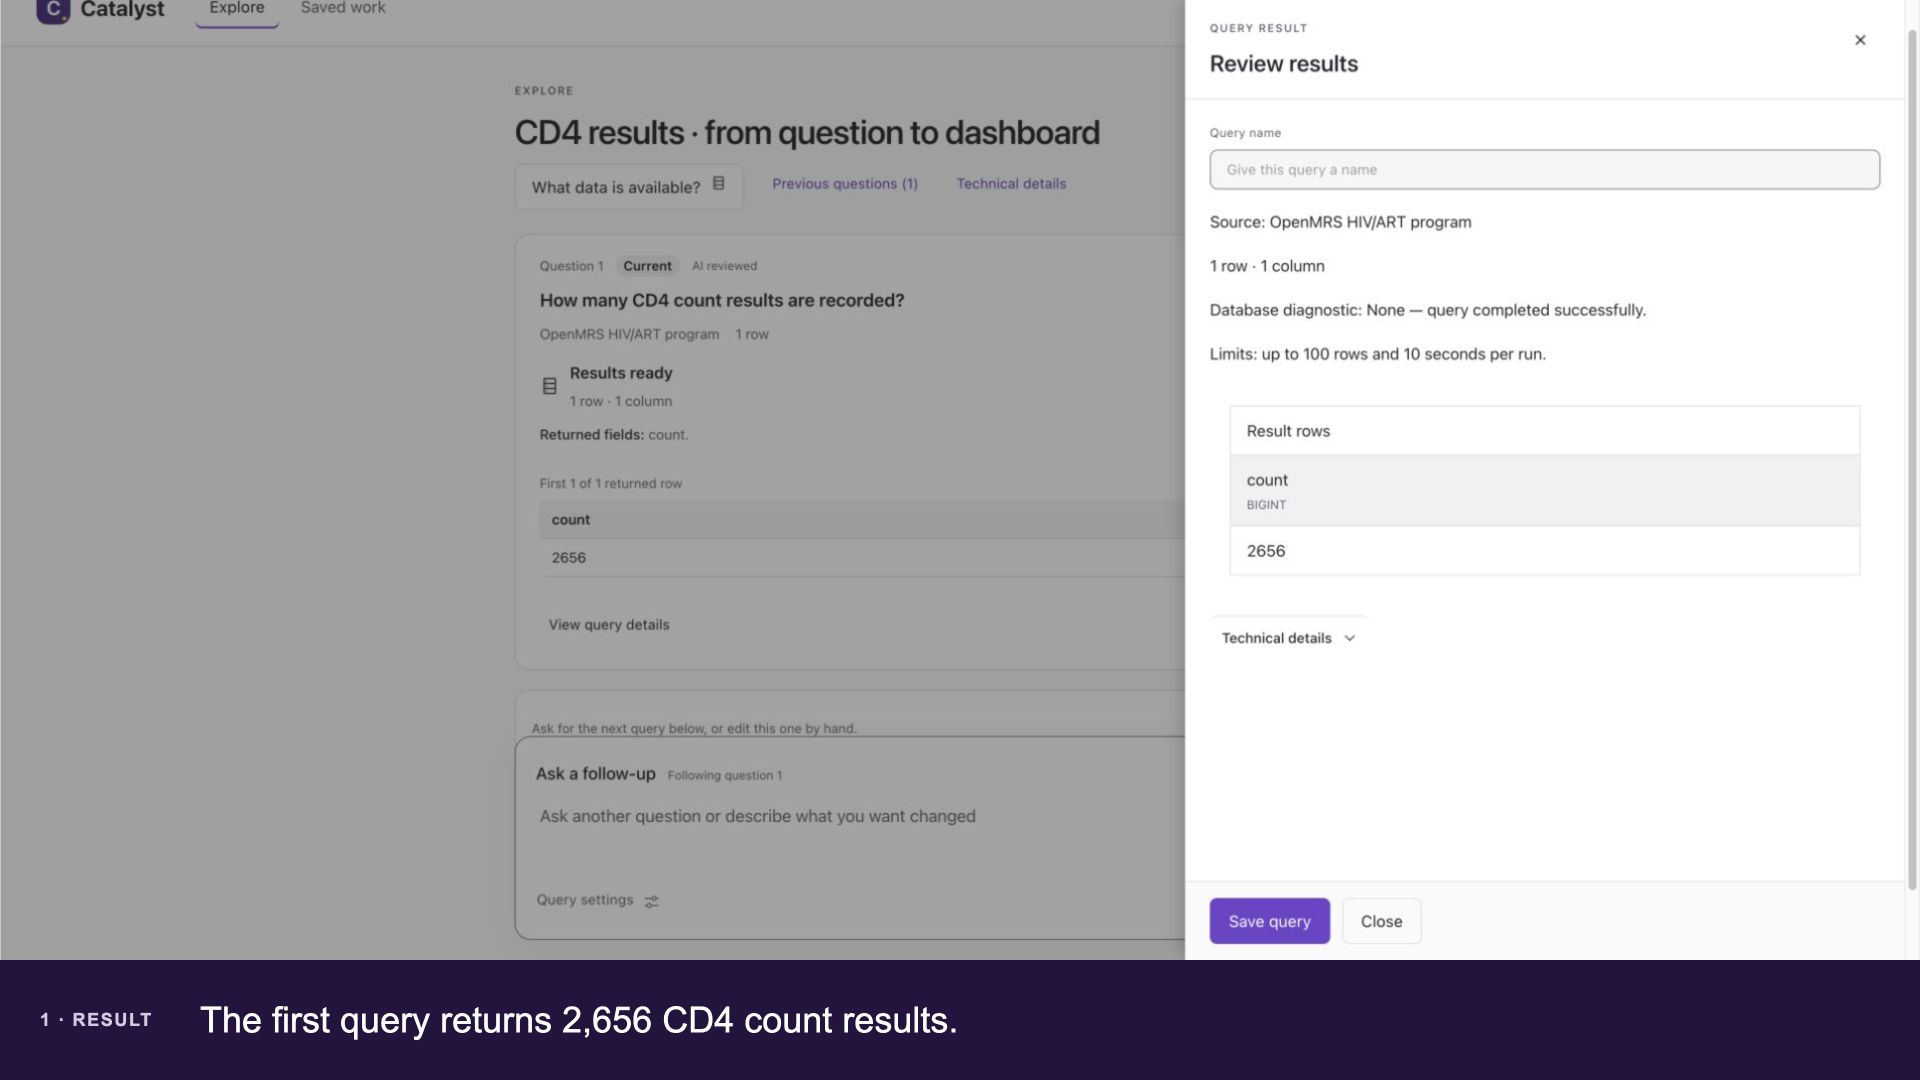
Review the total
The first query returns 2,656 CD4 count results.
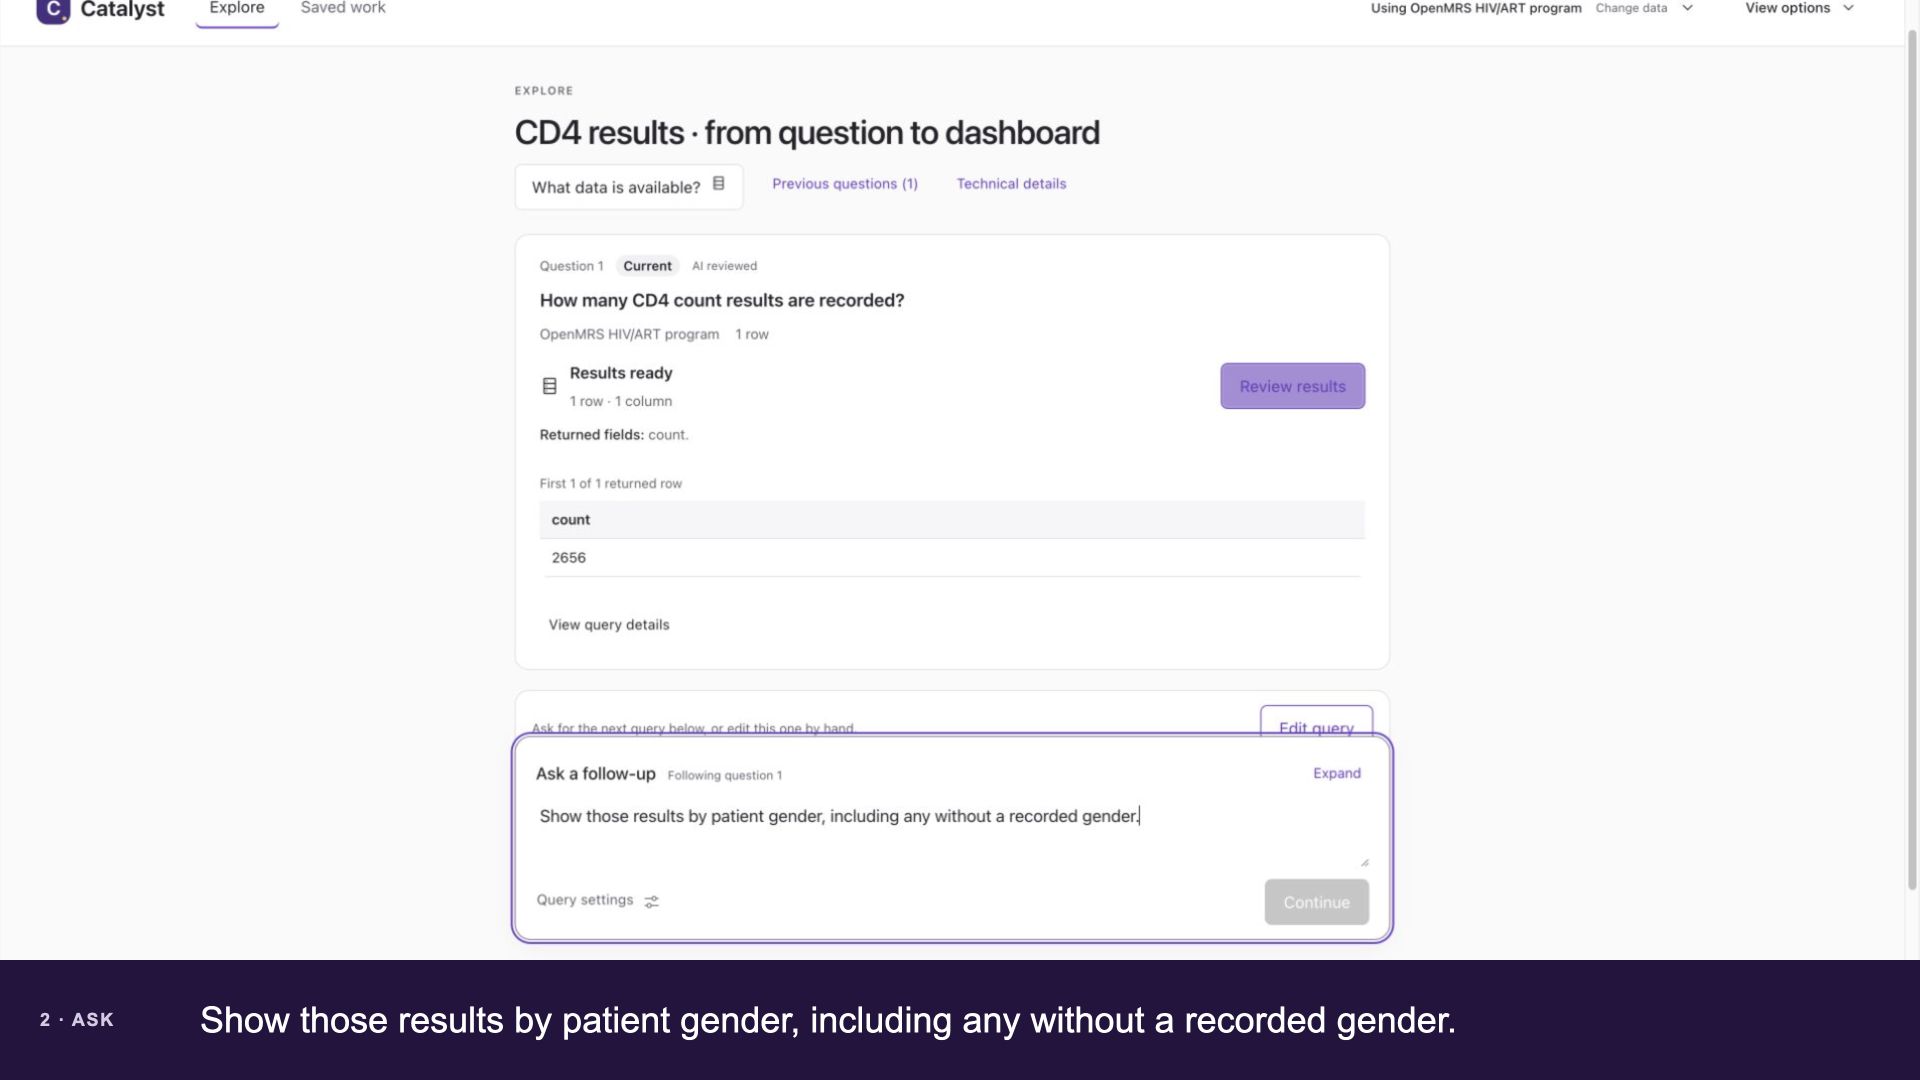
Ask a follow-up
Show those results by patient gender, including any without a recorded gender.
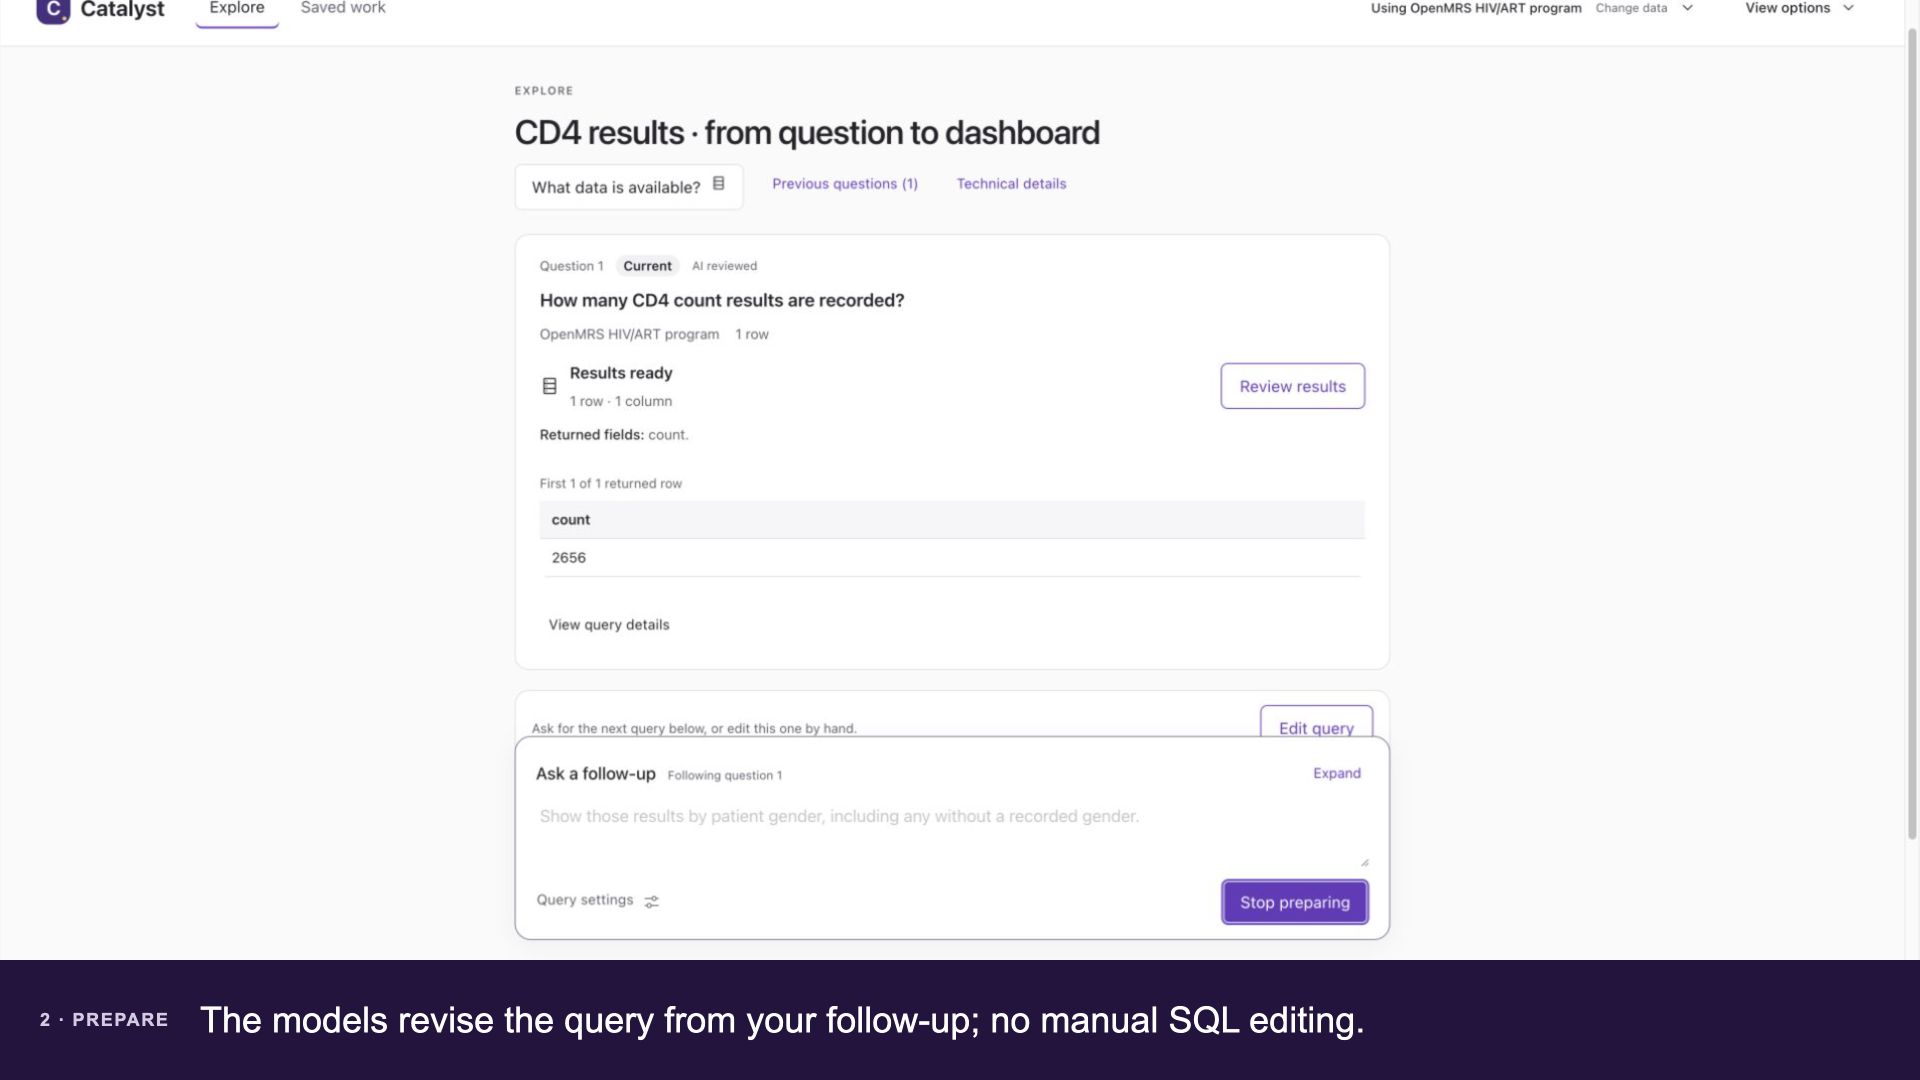
Prepare and review the refinement
The models revise the query from your follow-up; no manual SQL editing.
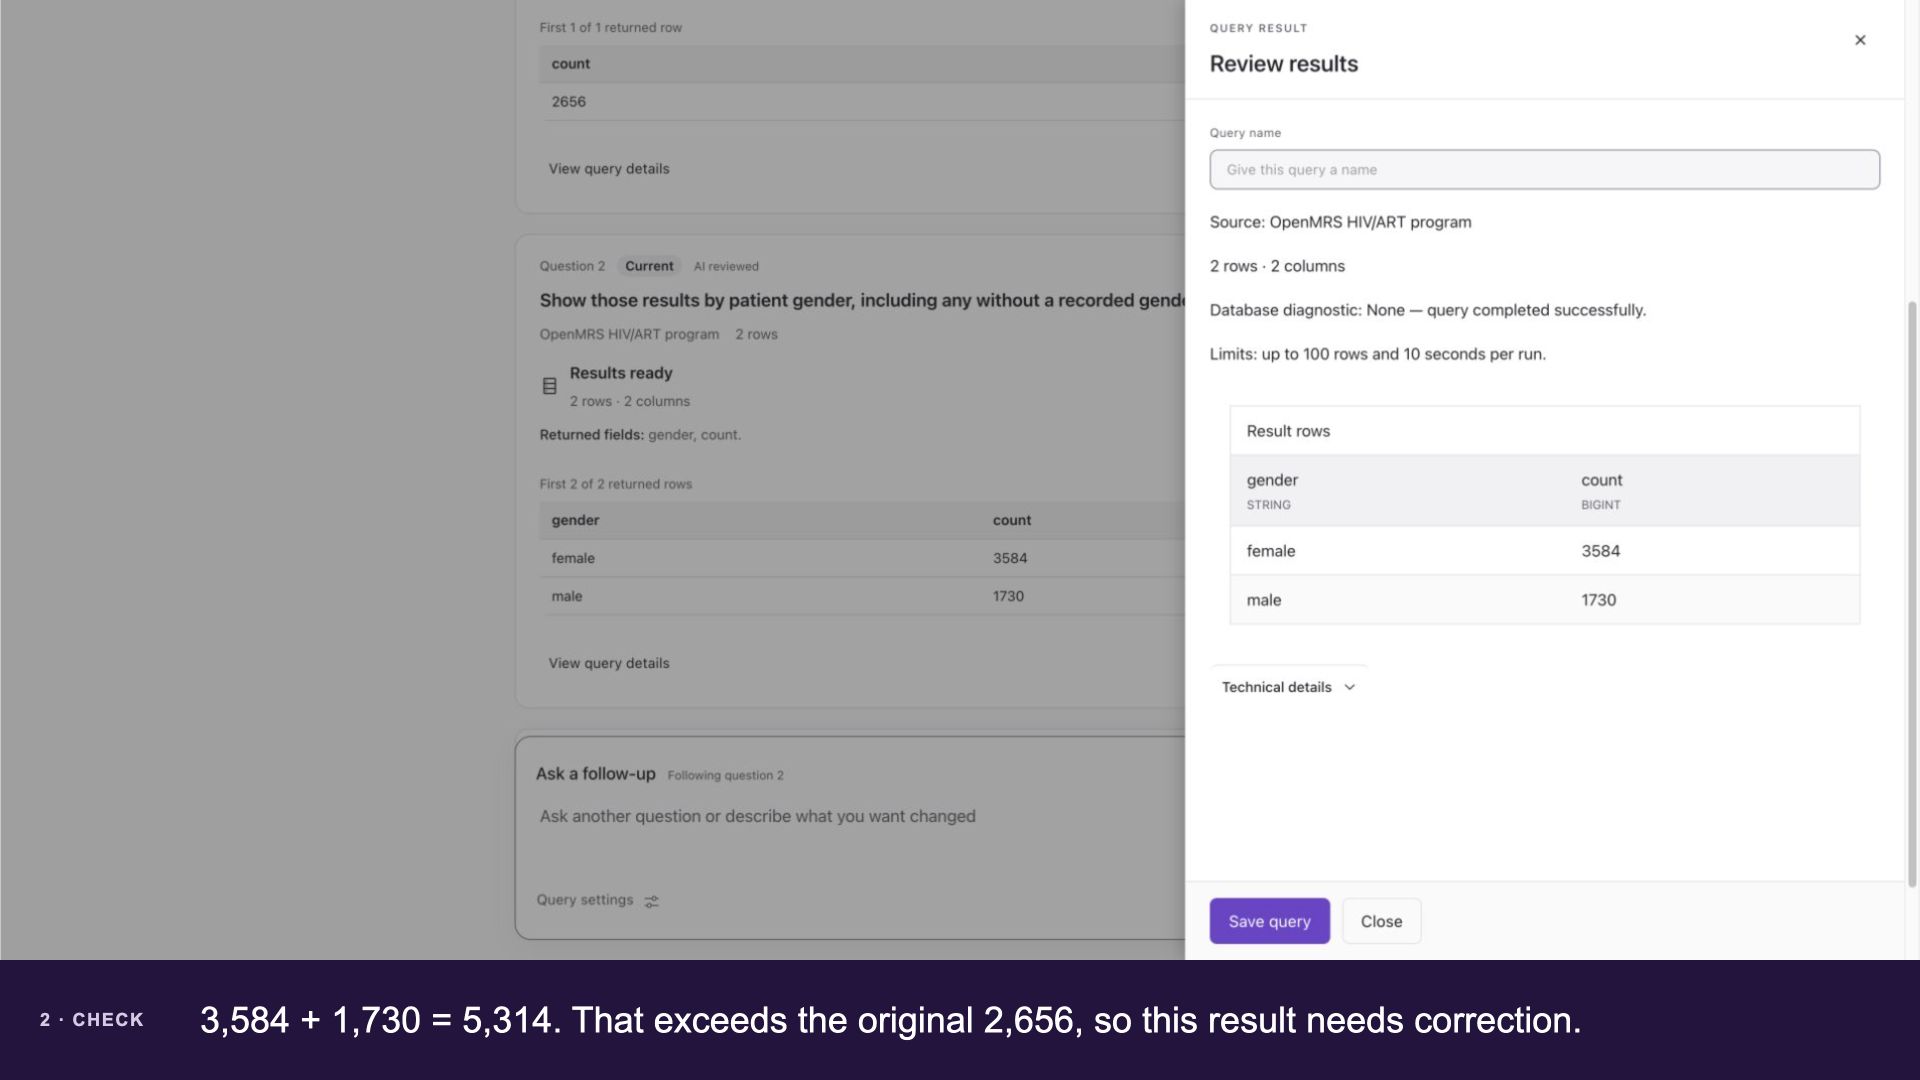
Catch the changed total
3,584 + 1,730 = 5,314. That exceeds the original 2,656, so this result needs correction.
Ask for a correction in plain language
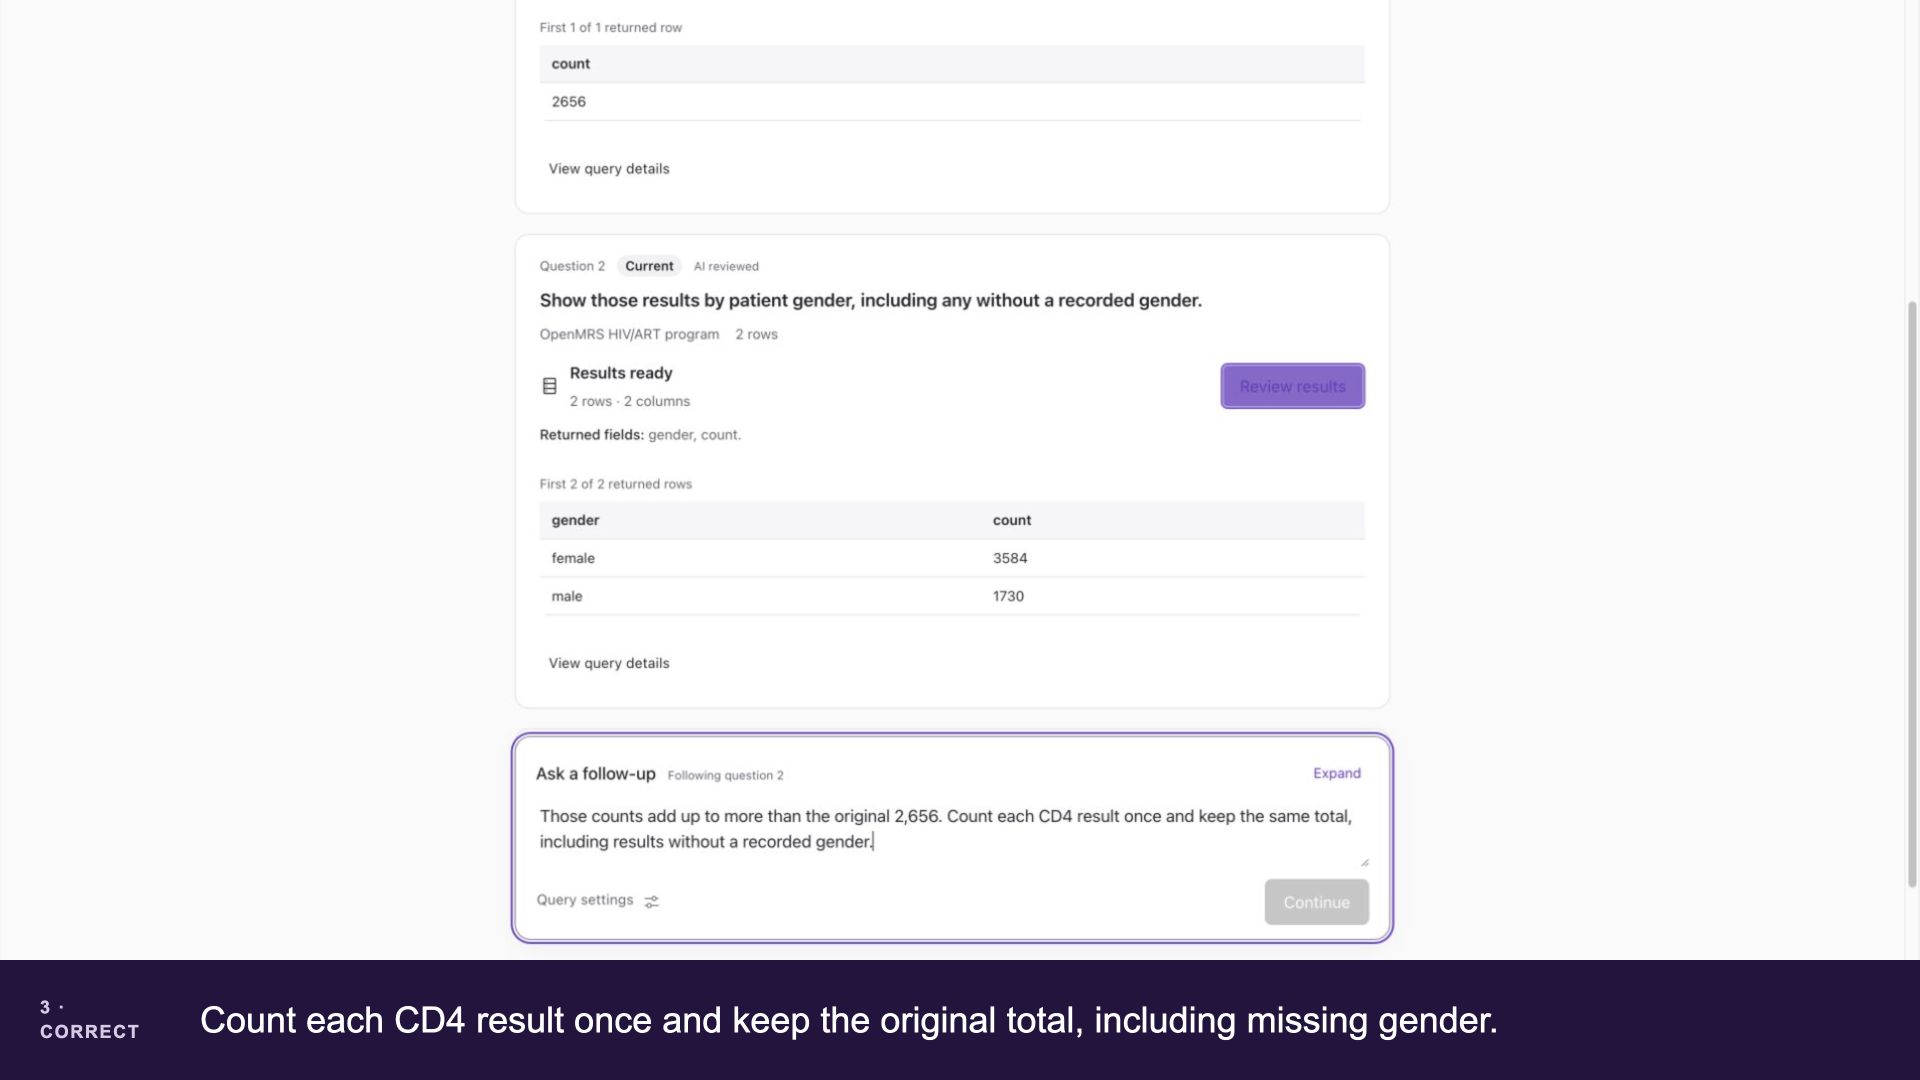
Count each CD4 result once and keep the original total, including missing gender.
Let the models correct the query
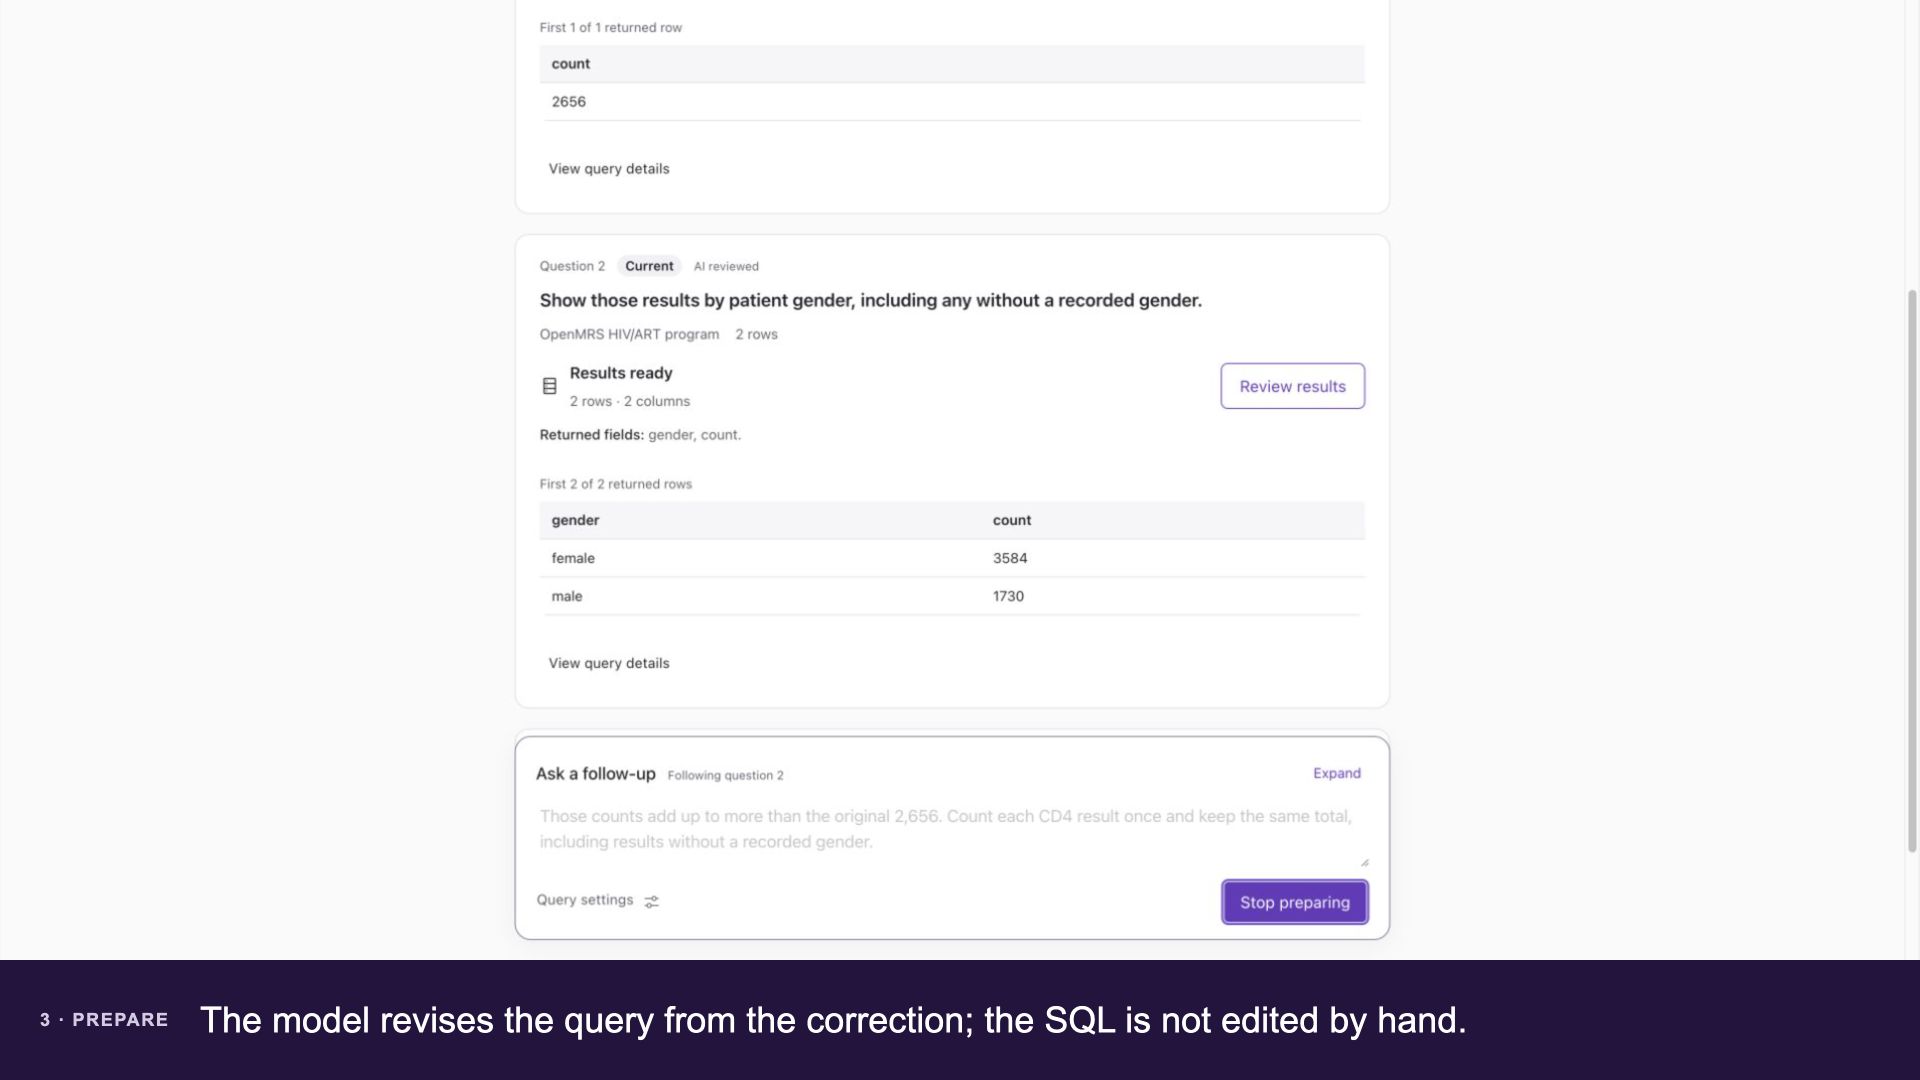
The model revises the query from the correction; the SQL is not edited by hand.
Review the complete corrected result
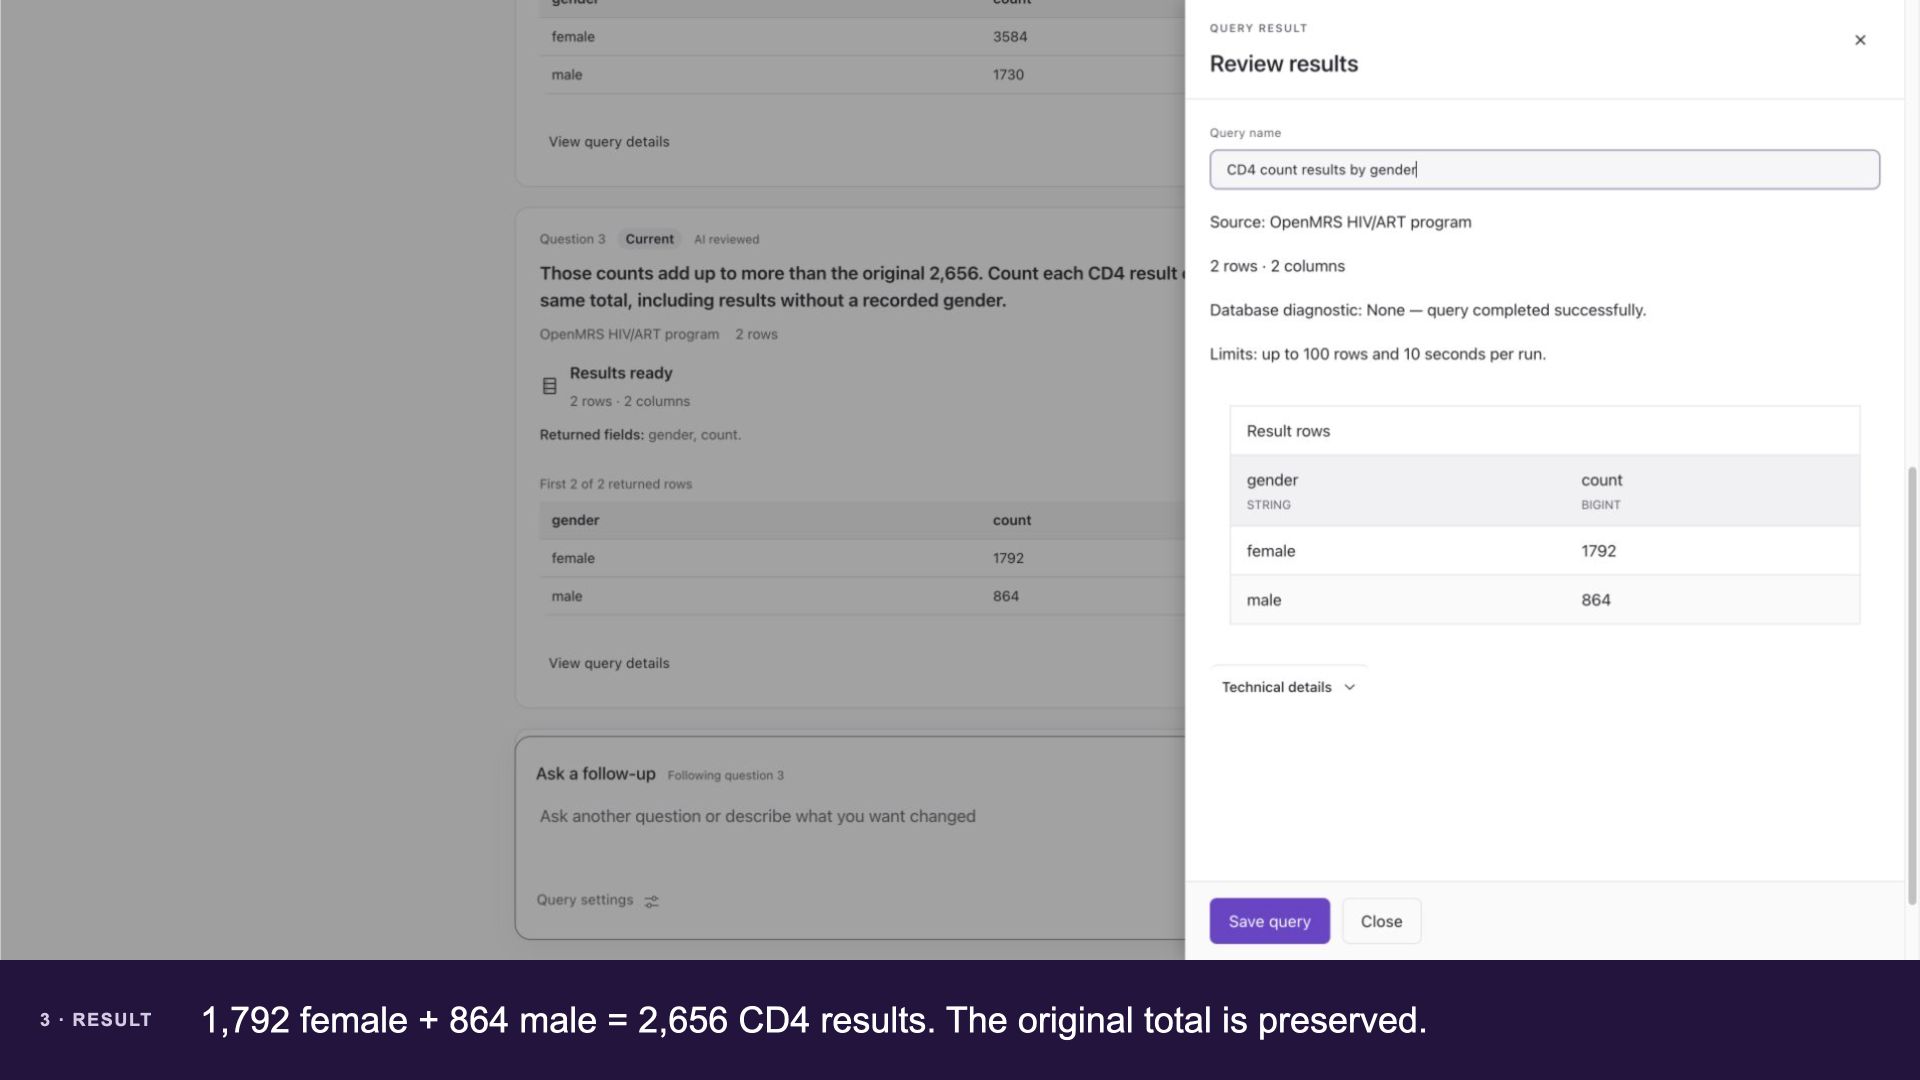
1,792 female + 864 male = 2,656 CD4 results. The original total is preserved.
Choose how to show the saved result
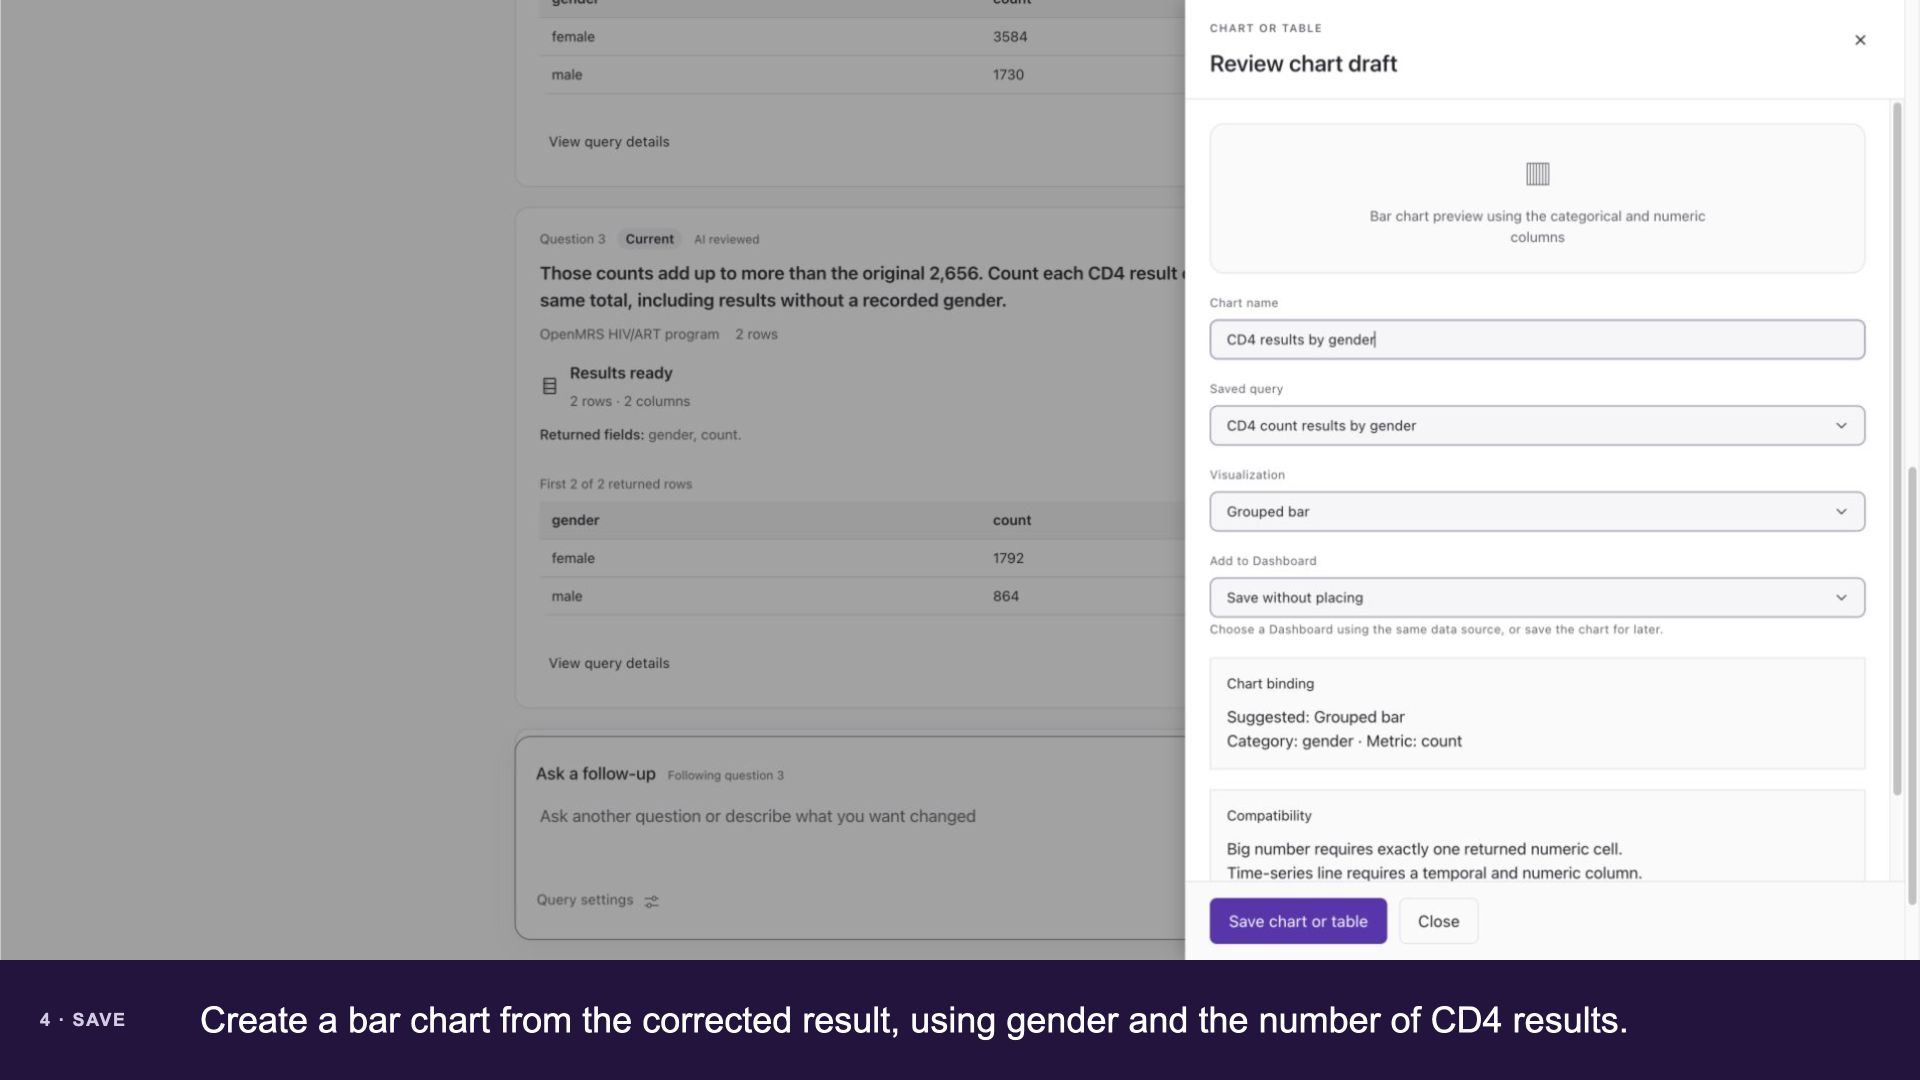
Create a bar chart from the corrected result, using gender and the number of CD4 results.
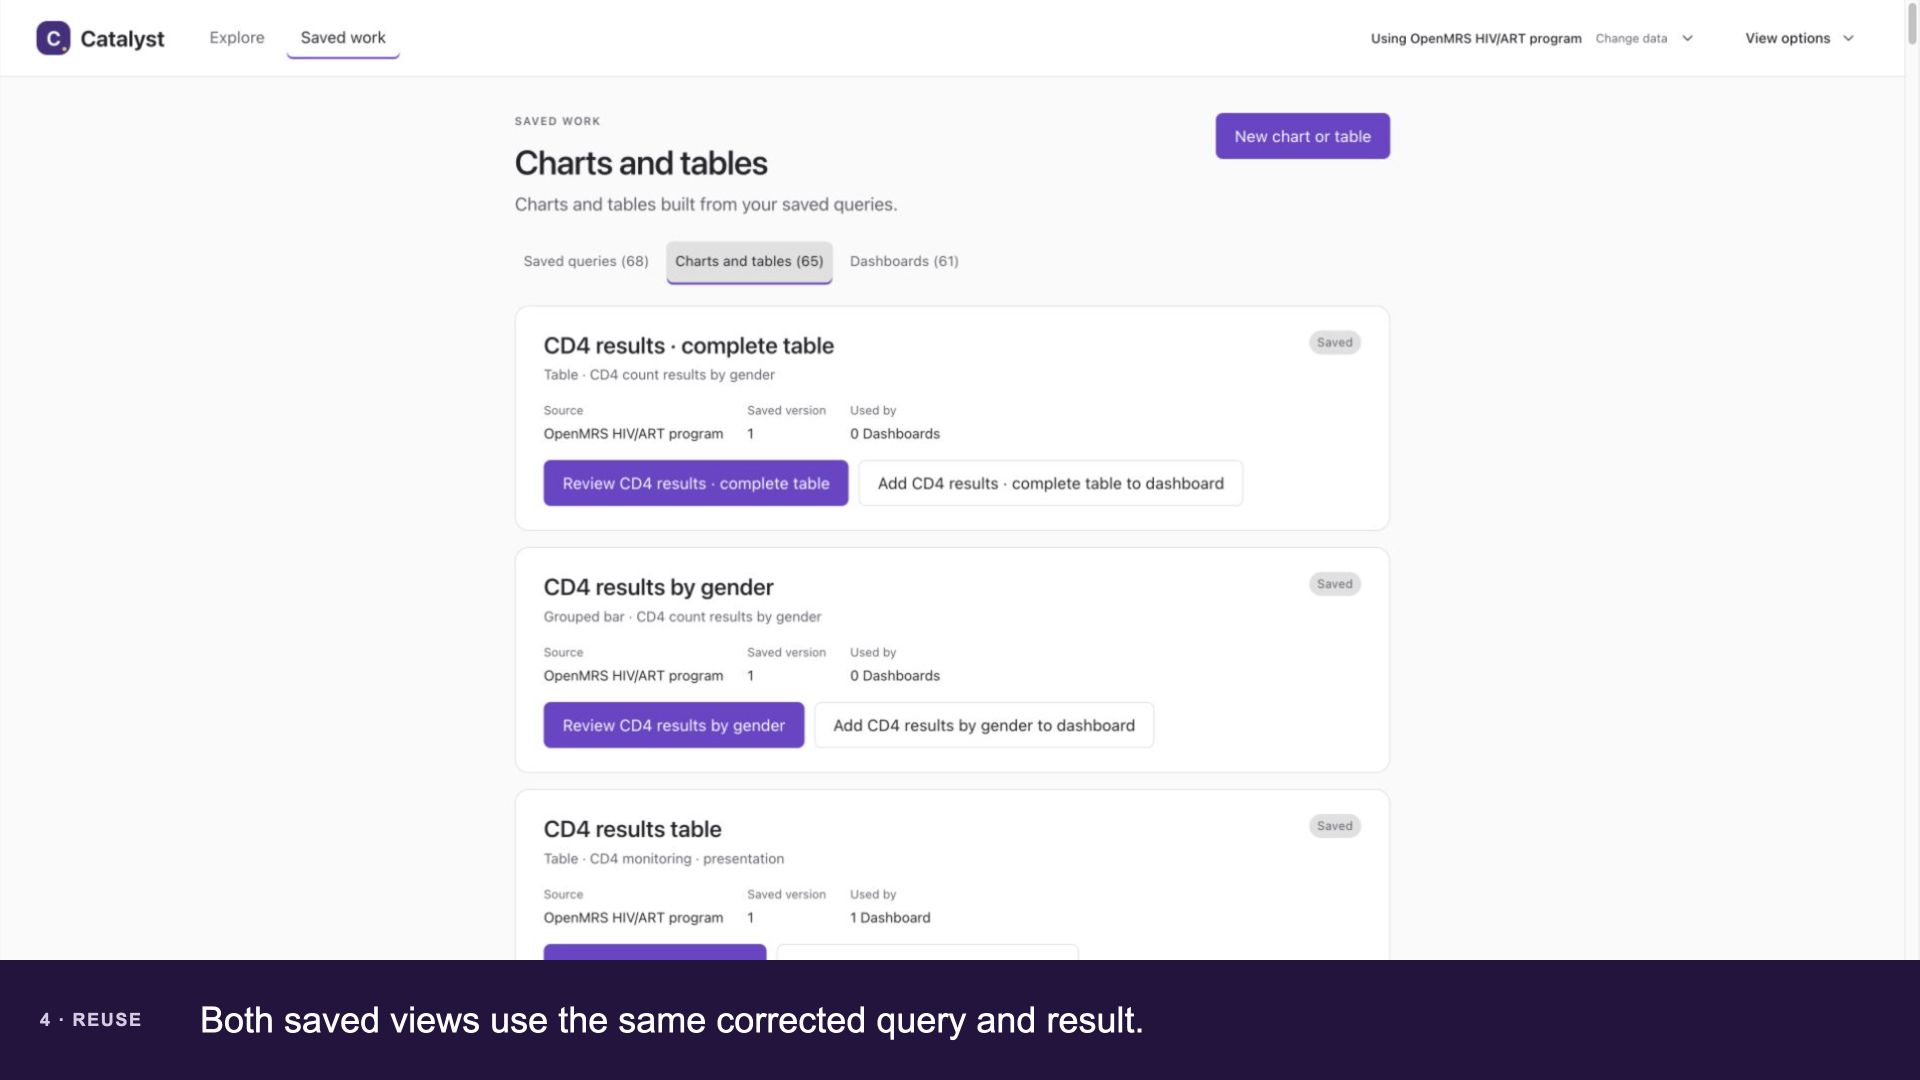
Keep a chart and the complete table
Both saved views use the same corrected query and result.
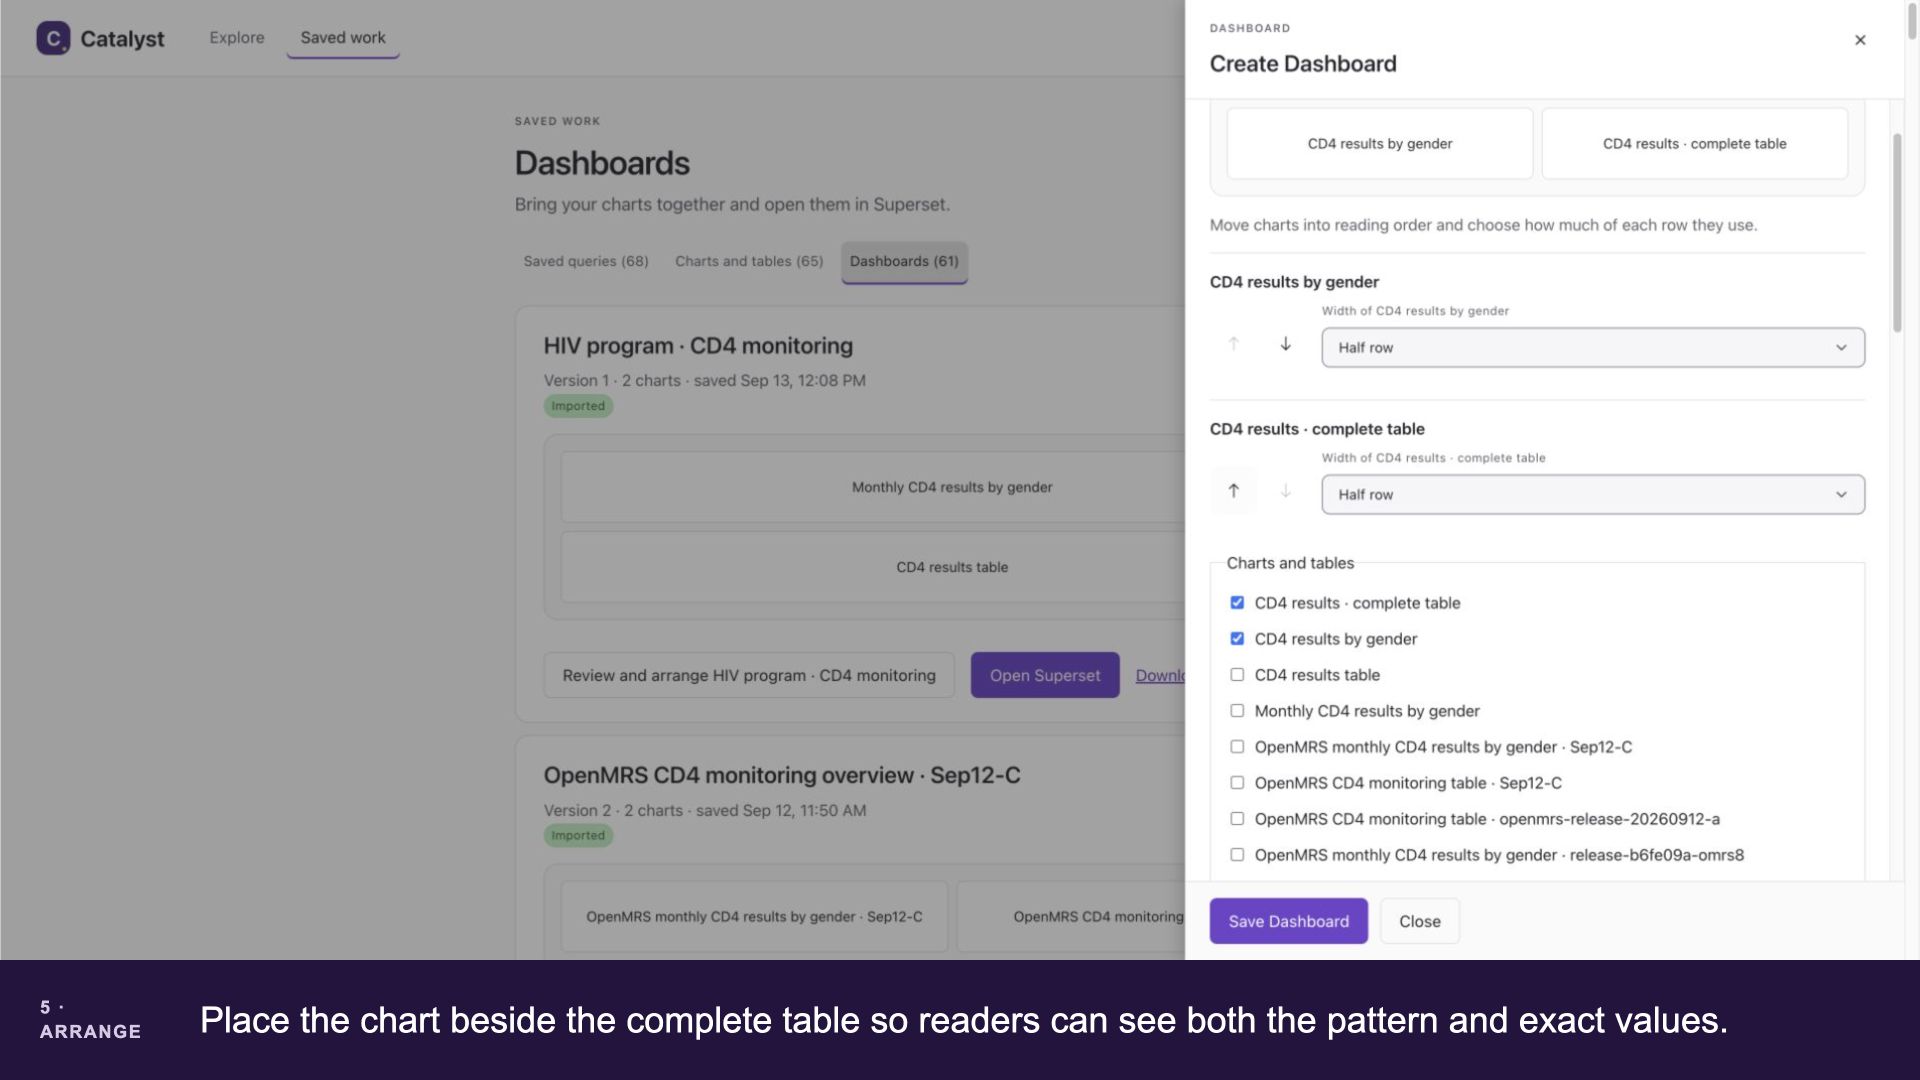
Arrange the dashboard
Place the chart beside the complete table so readers can see both the pattern and exact values.
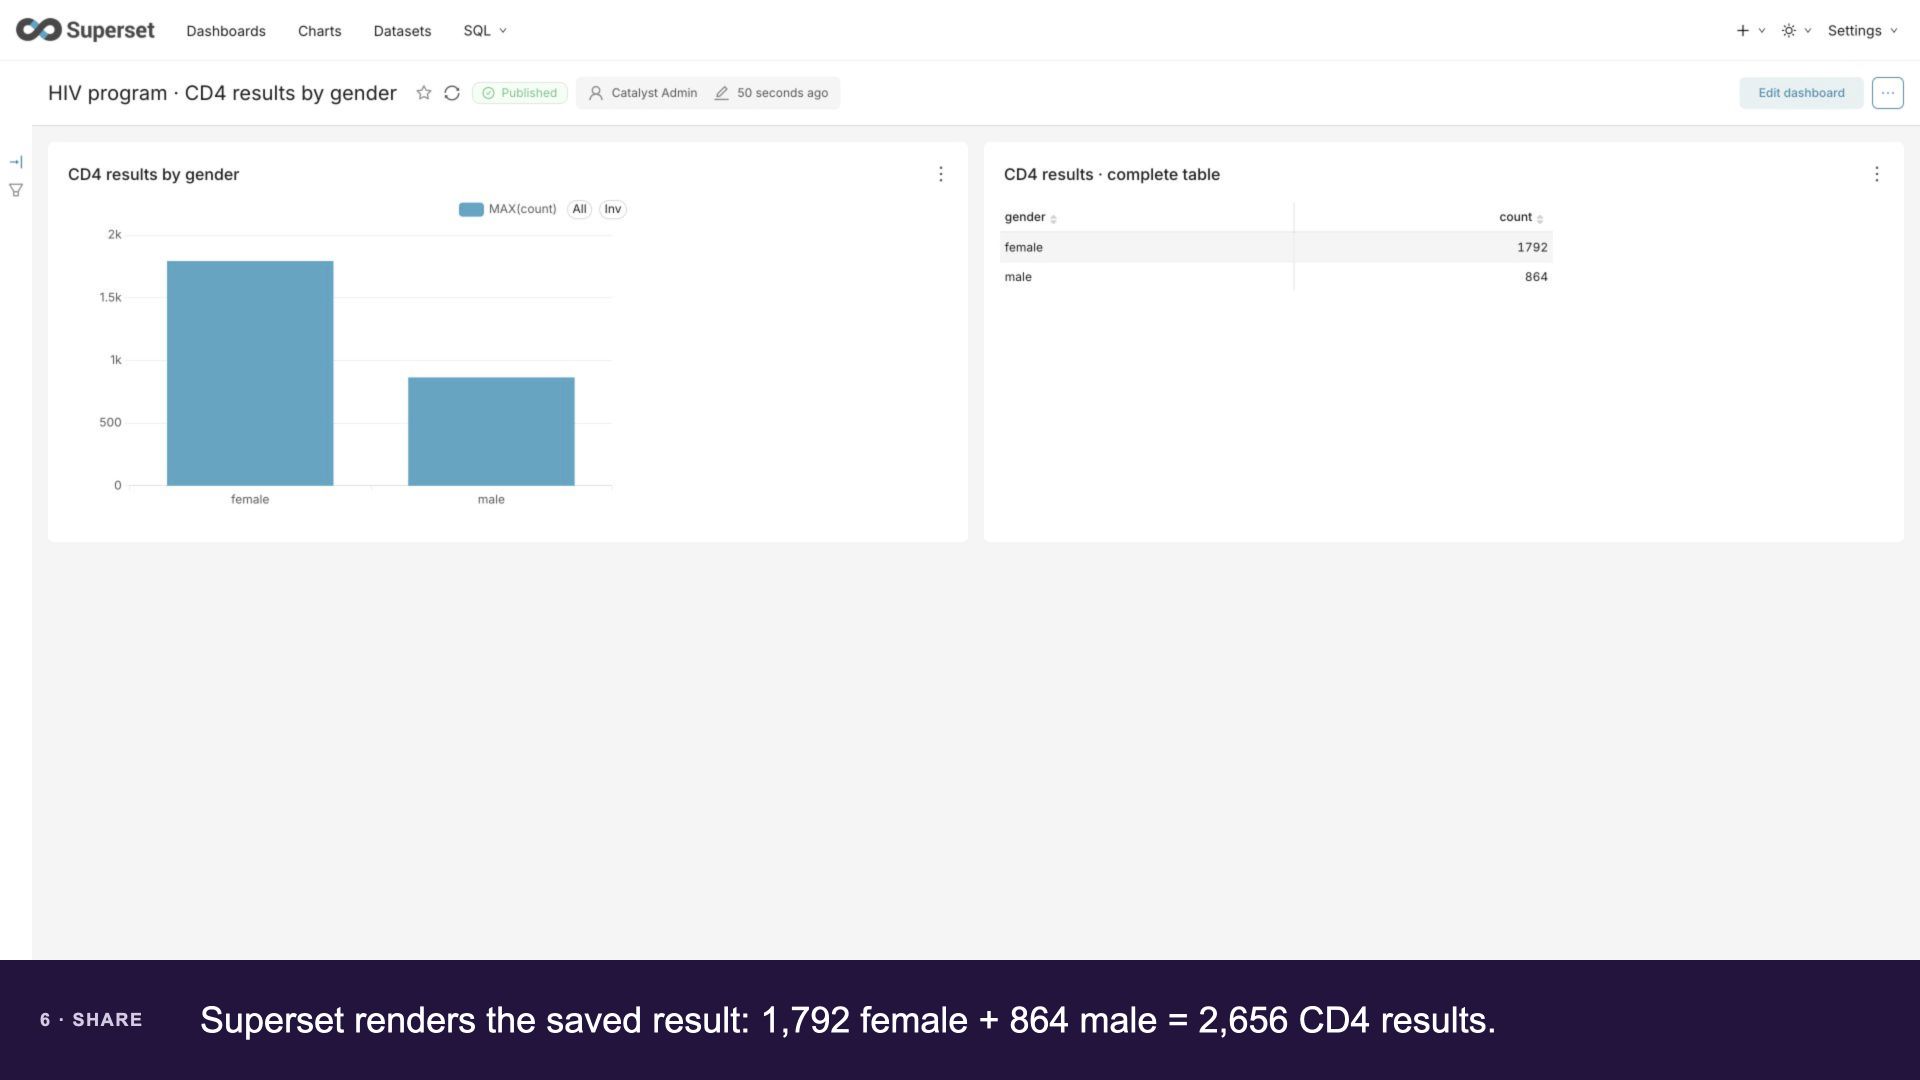
Open the finished dashboard
Superset renders the saved result: 1,792 female + 864 male = 2,656 CD4 results.
Inspect the generated SQL for all three turns
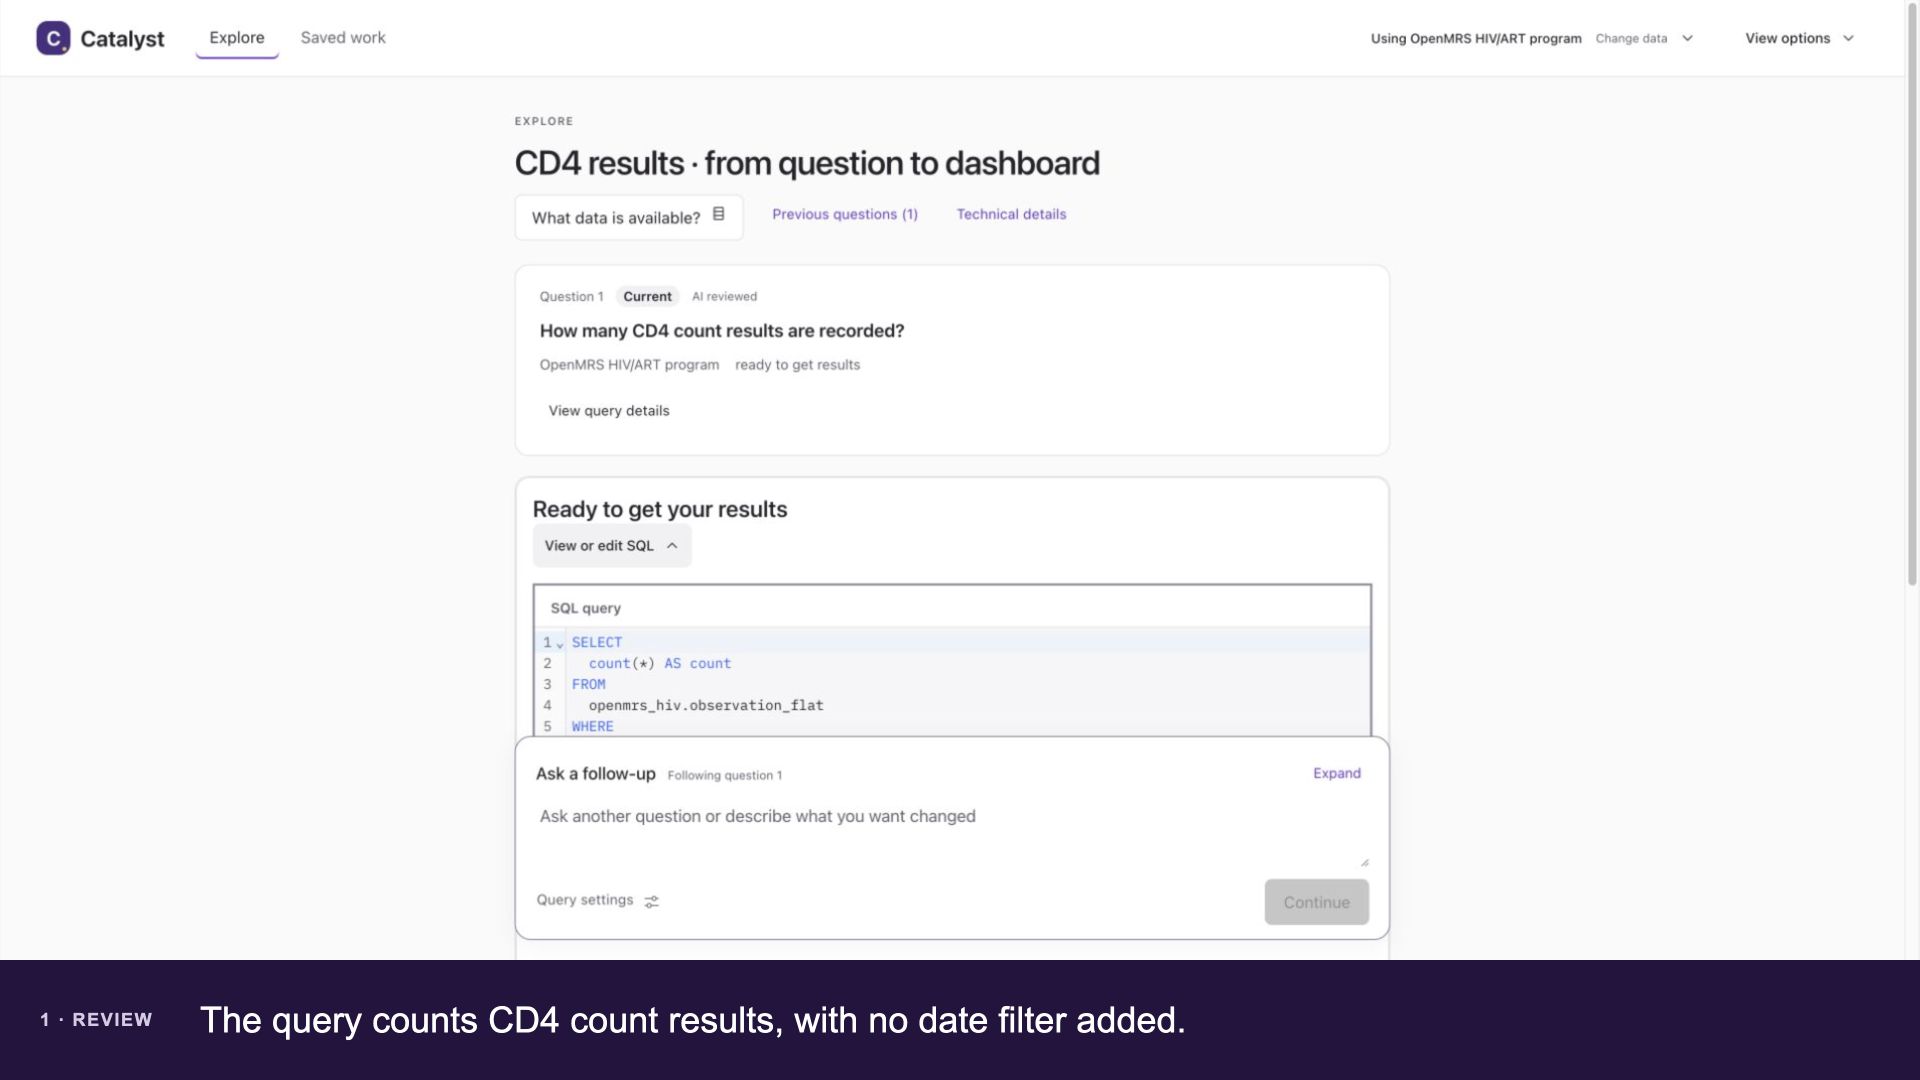
Inspect the generated query
The query counts CD4 count results, with no date filter added.
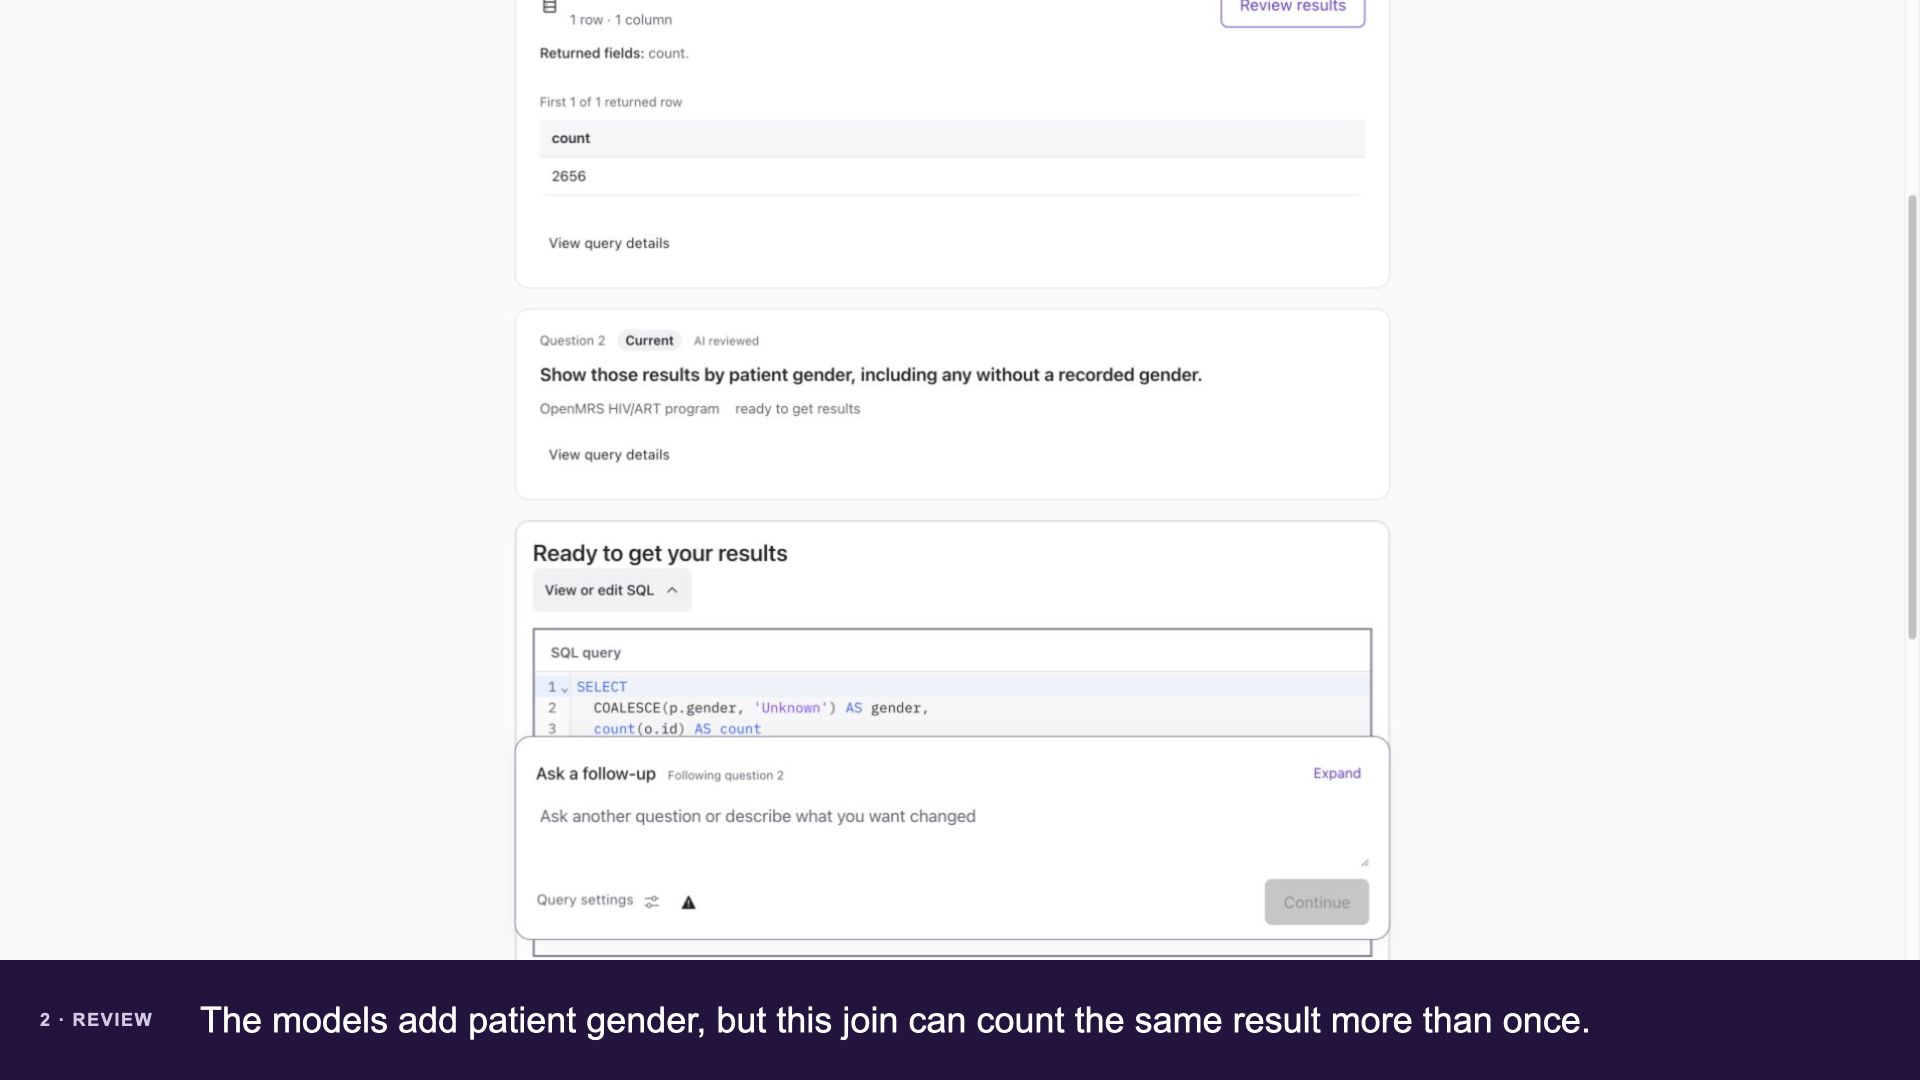
Inspect the proposed gender breakdown
The models add patient gender, but this join can count the same result more than once.
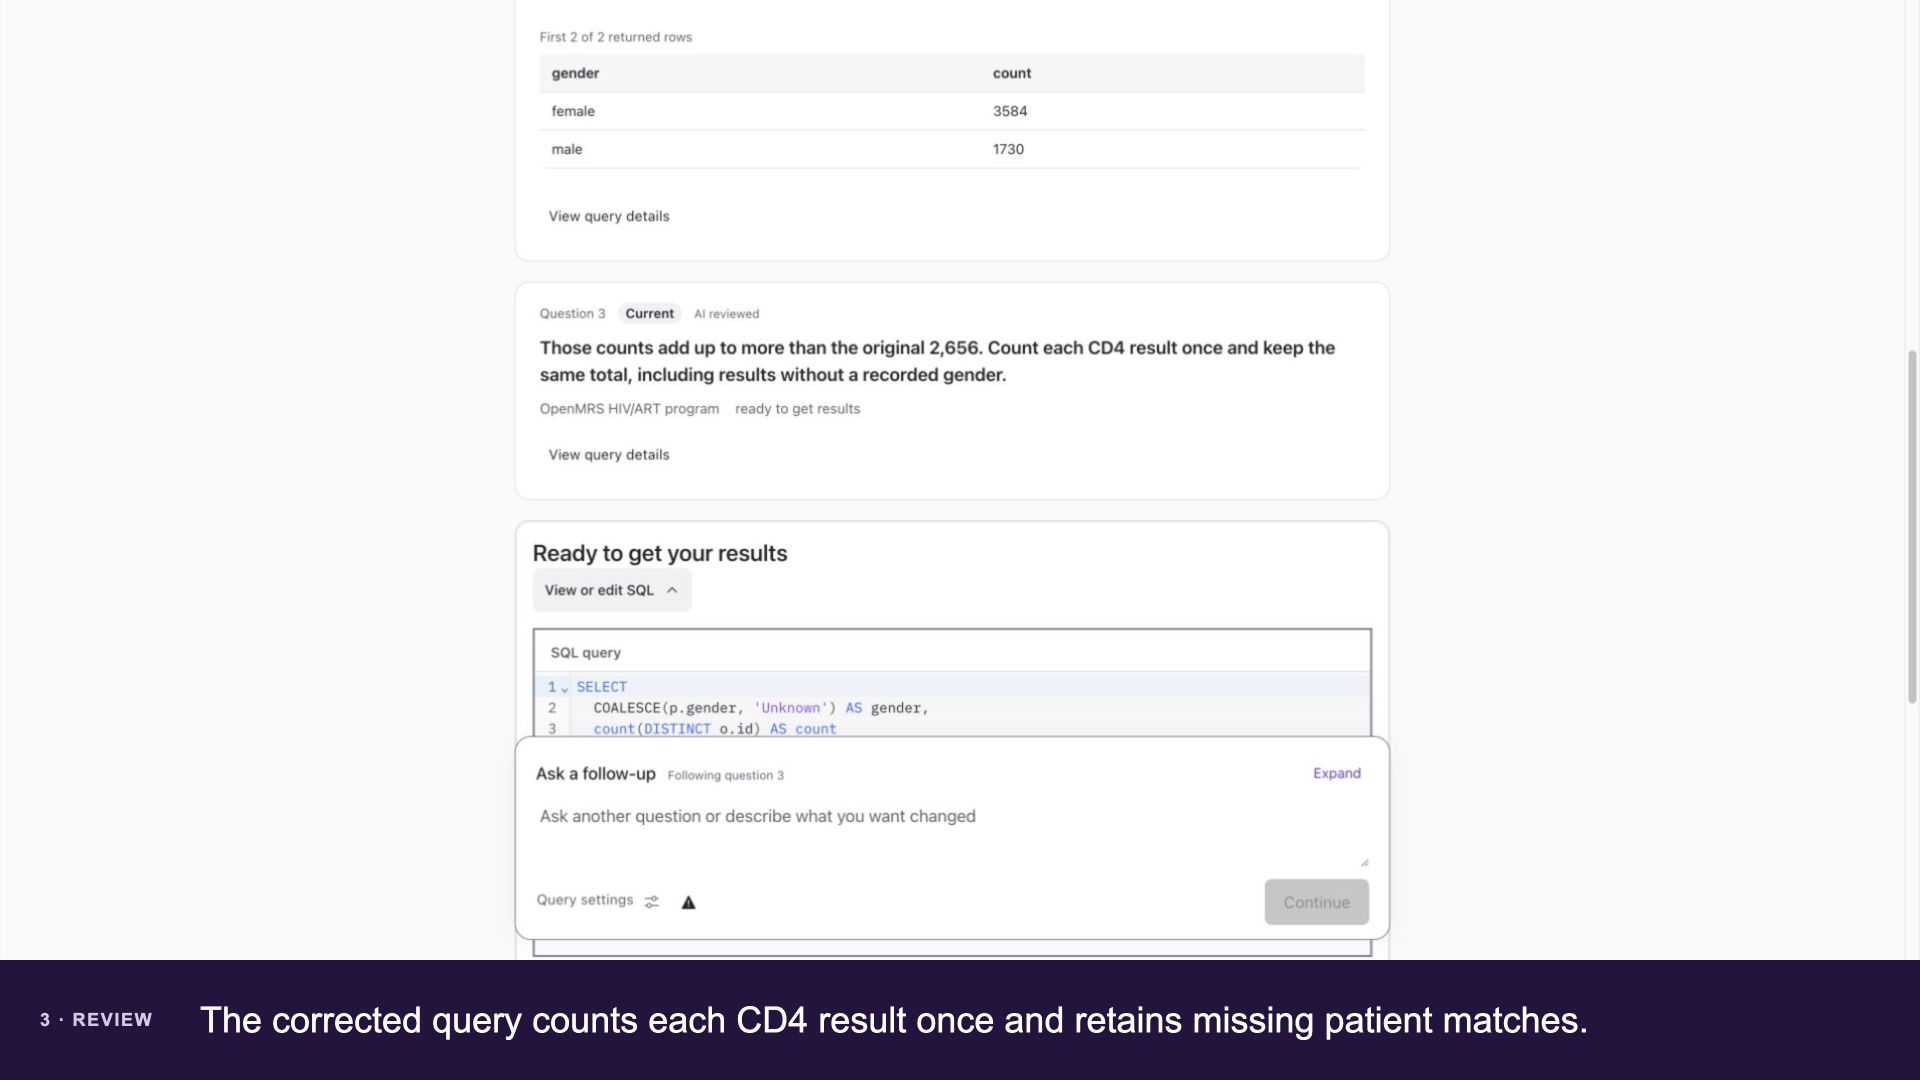
Inspect the model correction
The corrected query counts each CD4 result once and retains missing patient matches.
Look beyond the demonstration
These published examples show a completed ChartSearchAI evaluation from July 2026 and a Catalyst development comparison from August 2026. They preserve the strengths, failures and supporting records of those historical runs. These belong to the Validation Harness evaluation work, separate from the Catalyst workflow above.
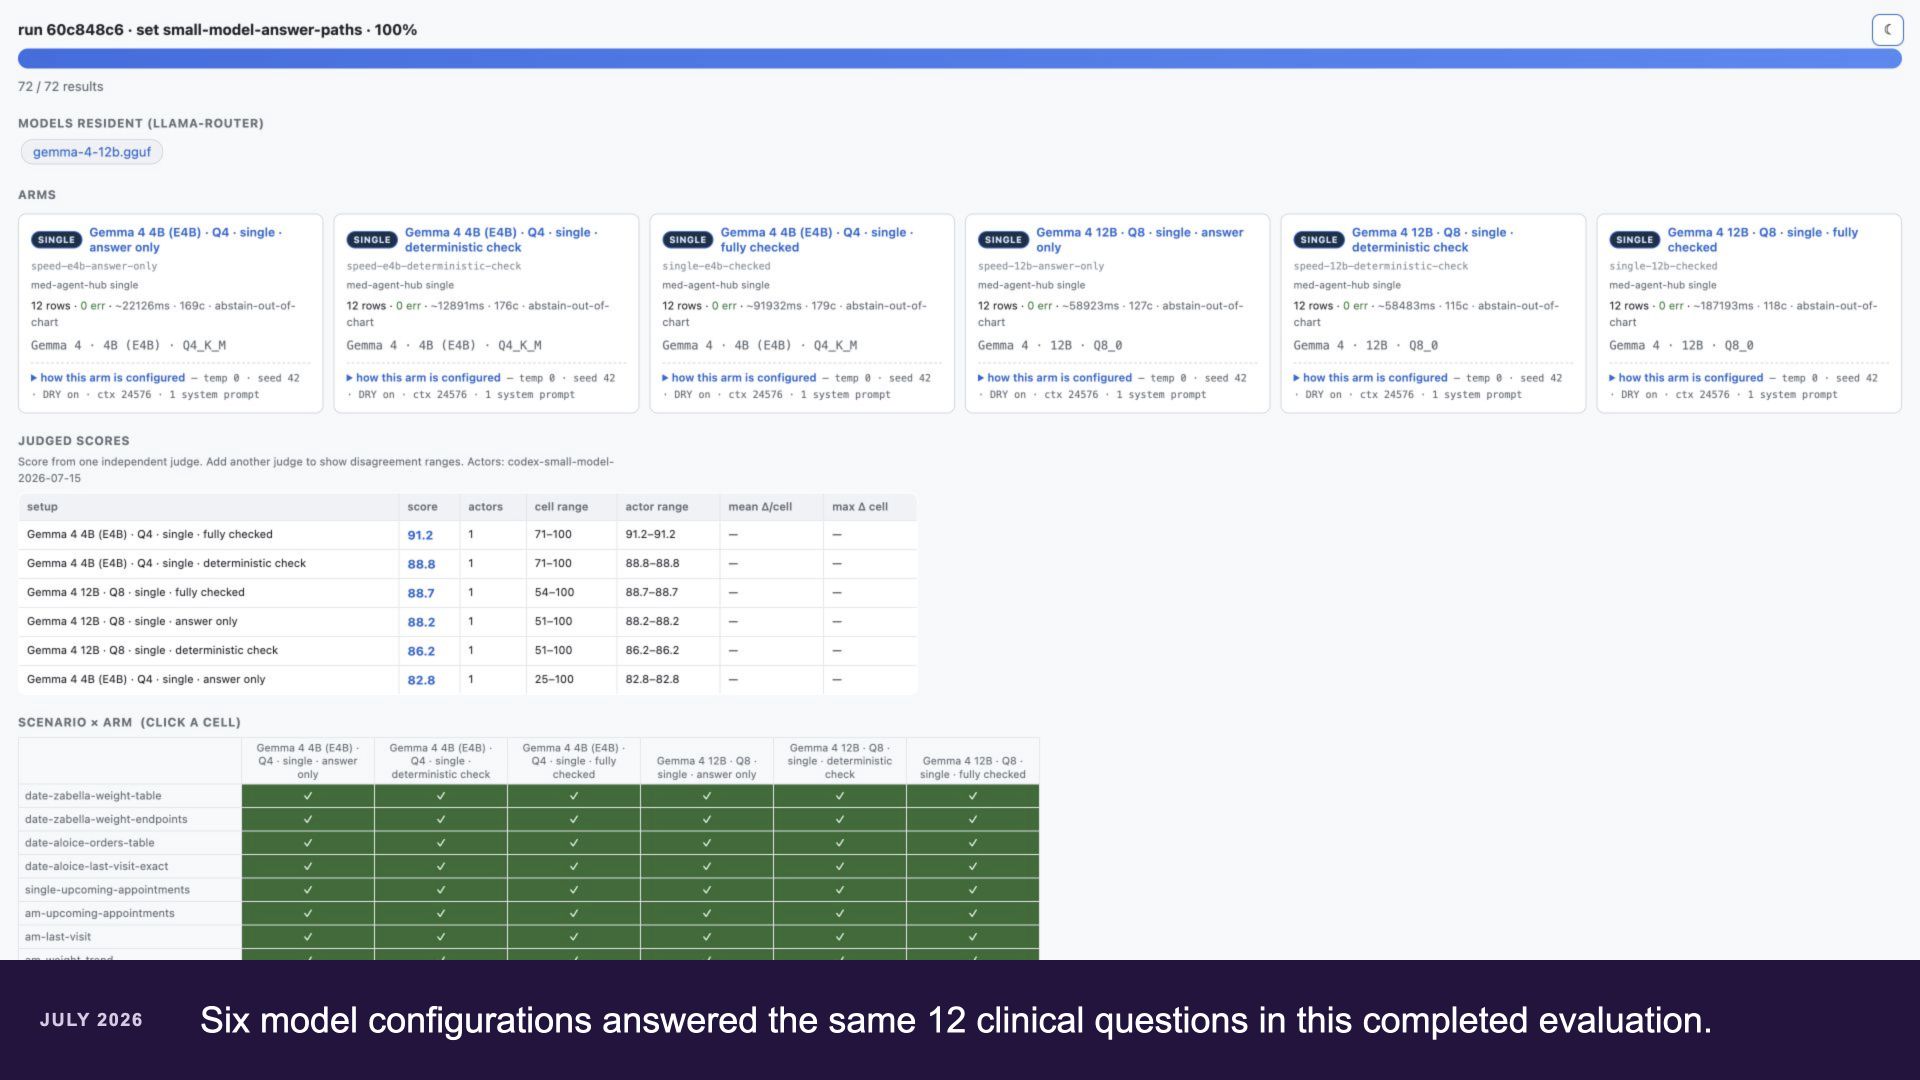
A completed evaluation run
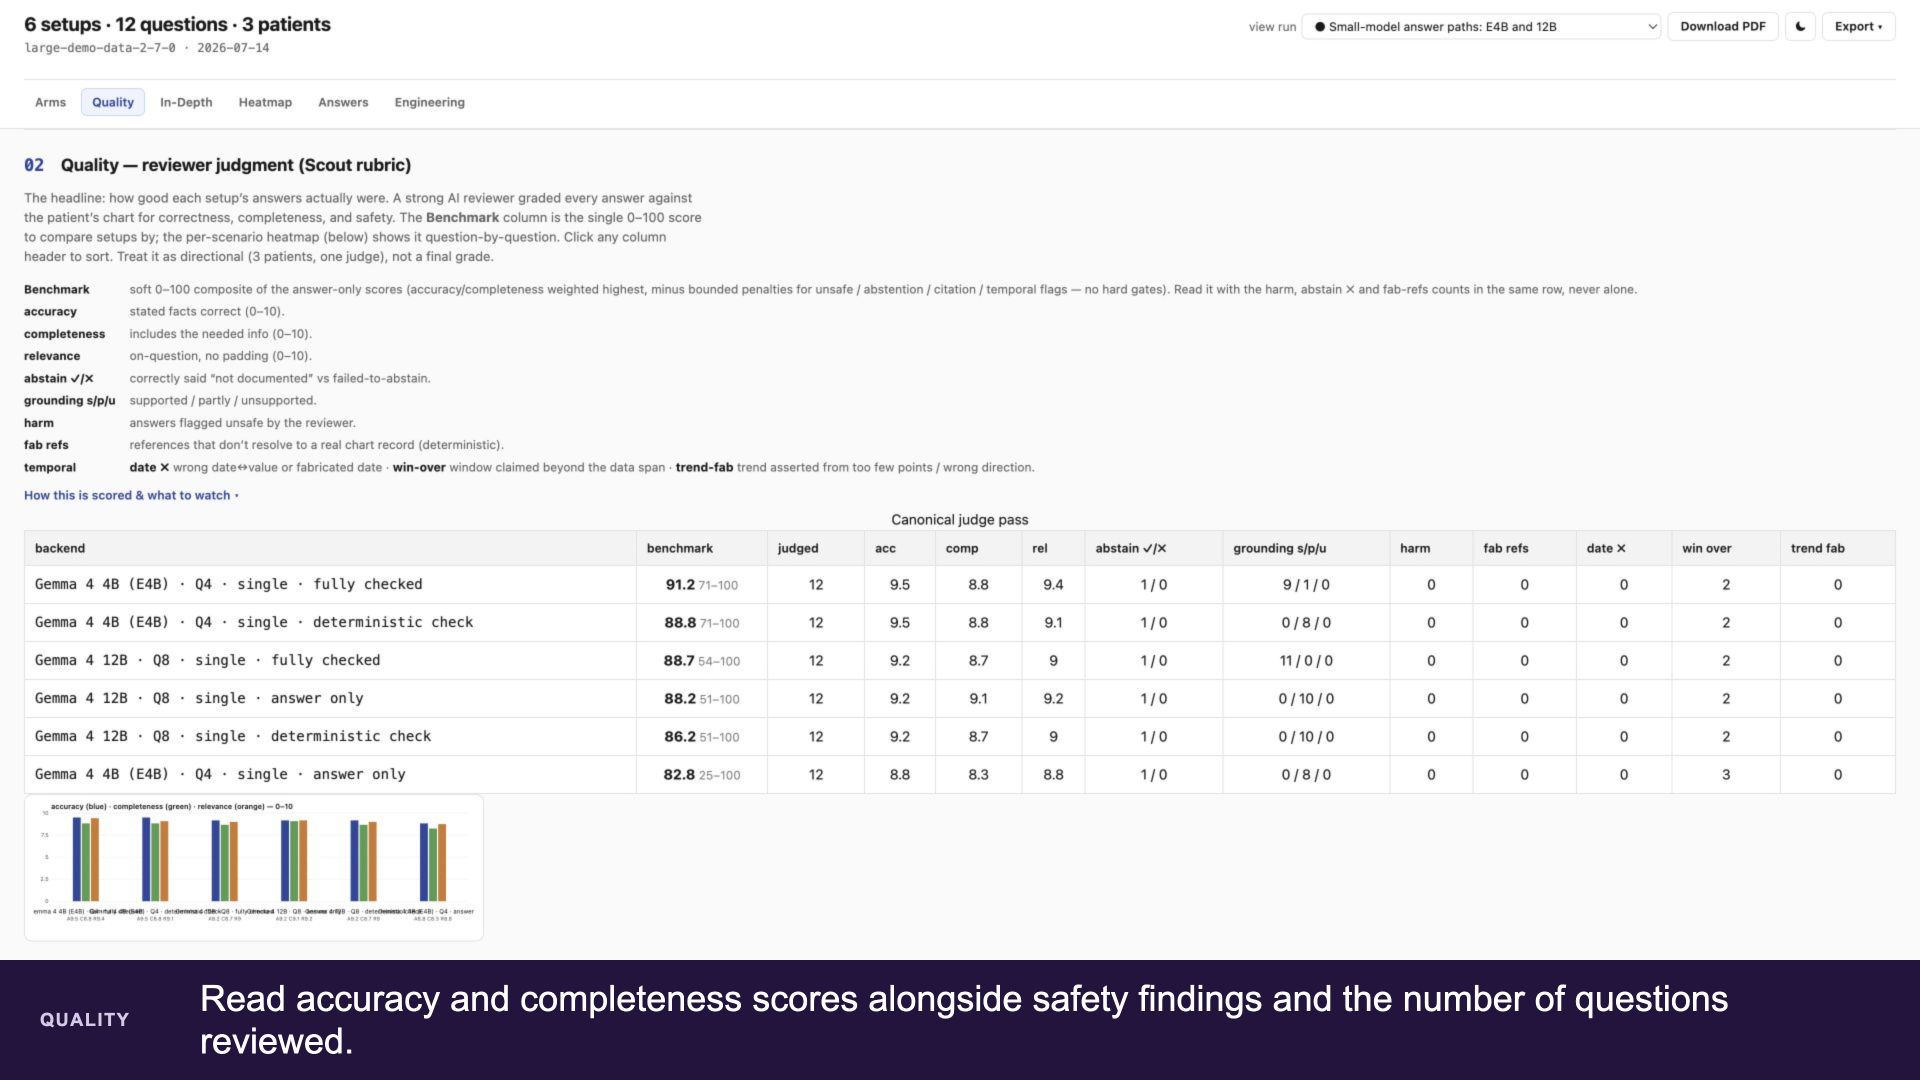
Six model configurations answered the same 12 clinical questions in this completed evaluation.
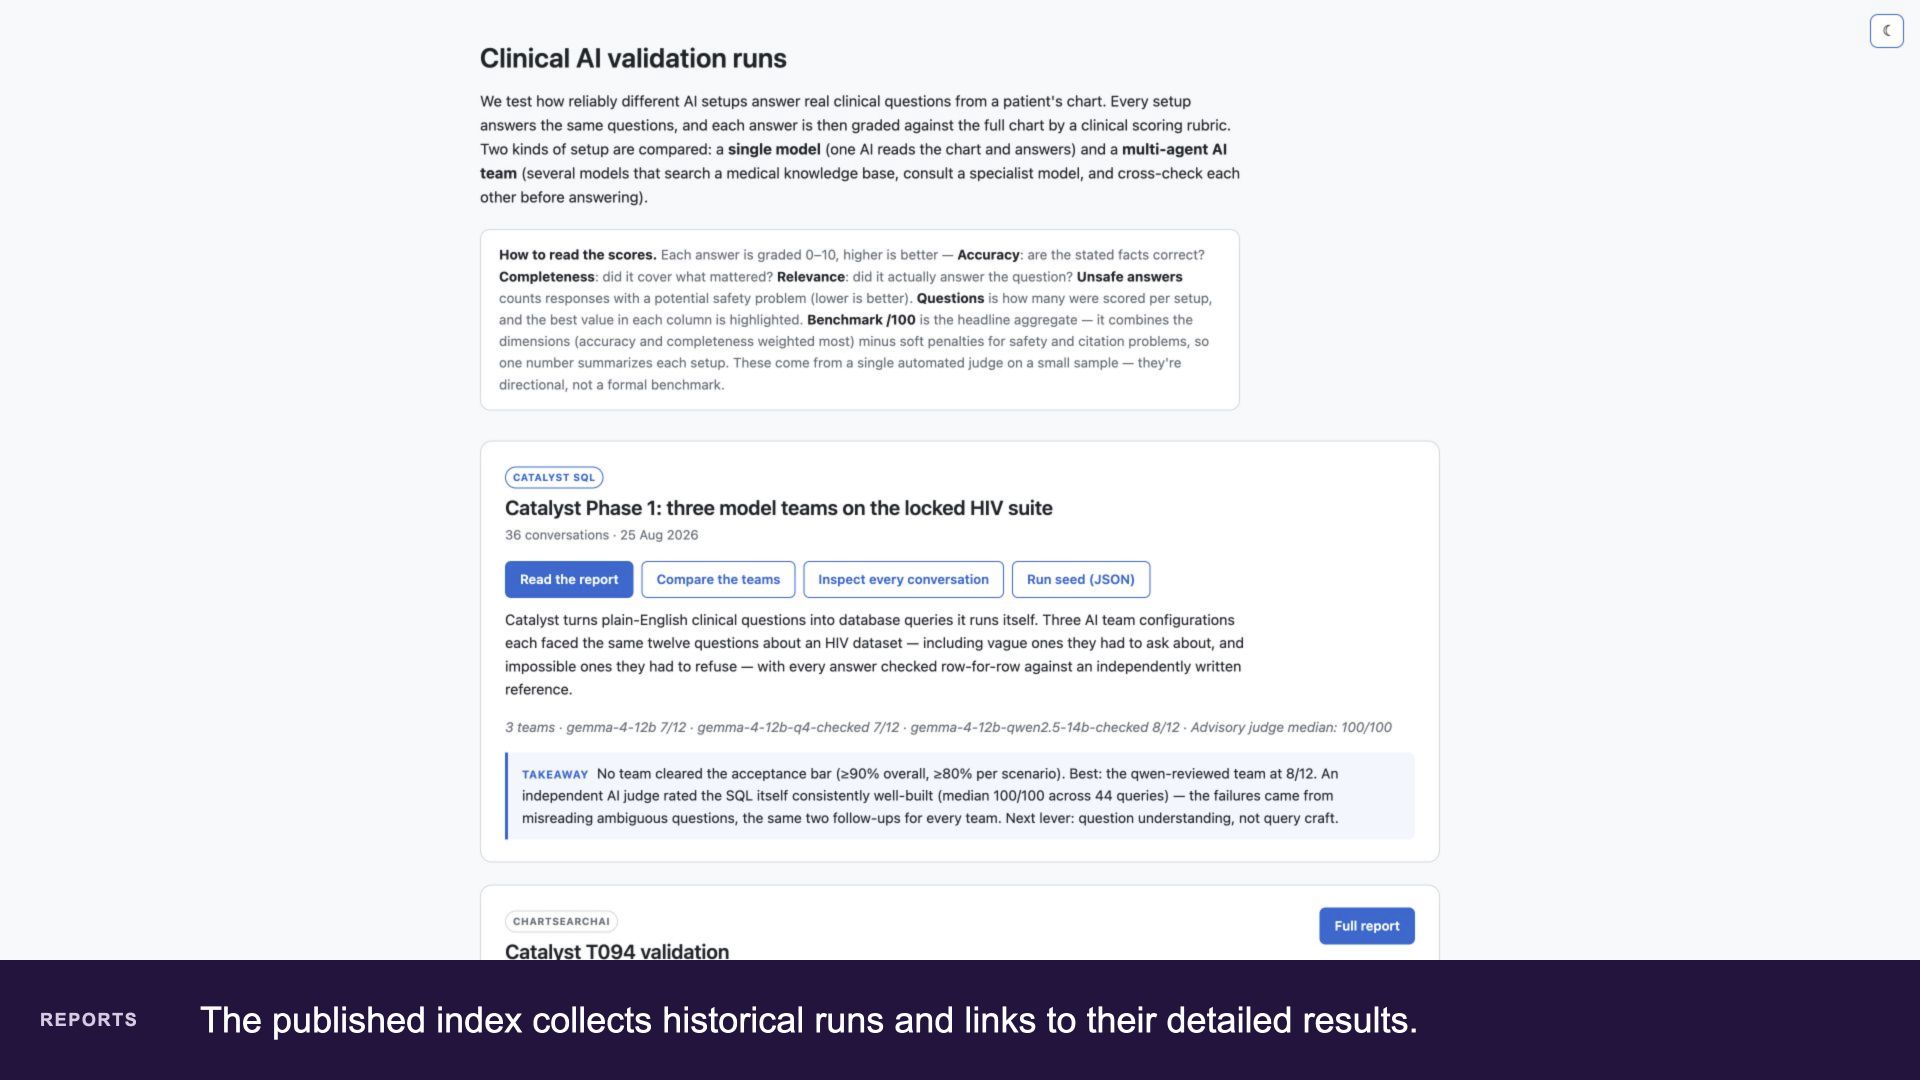
Browse published reports
The published index collects historical runs and links to their detailed results.
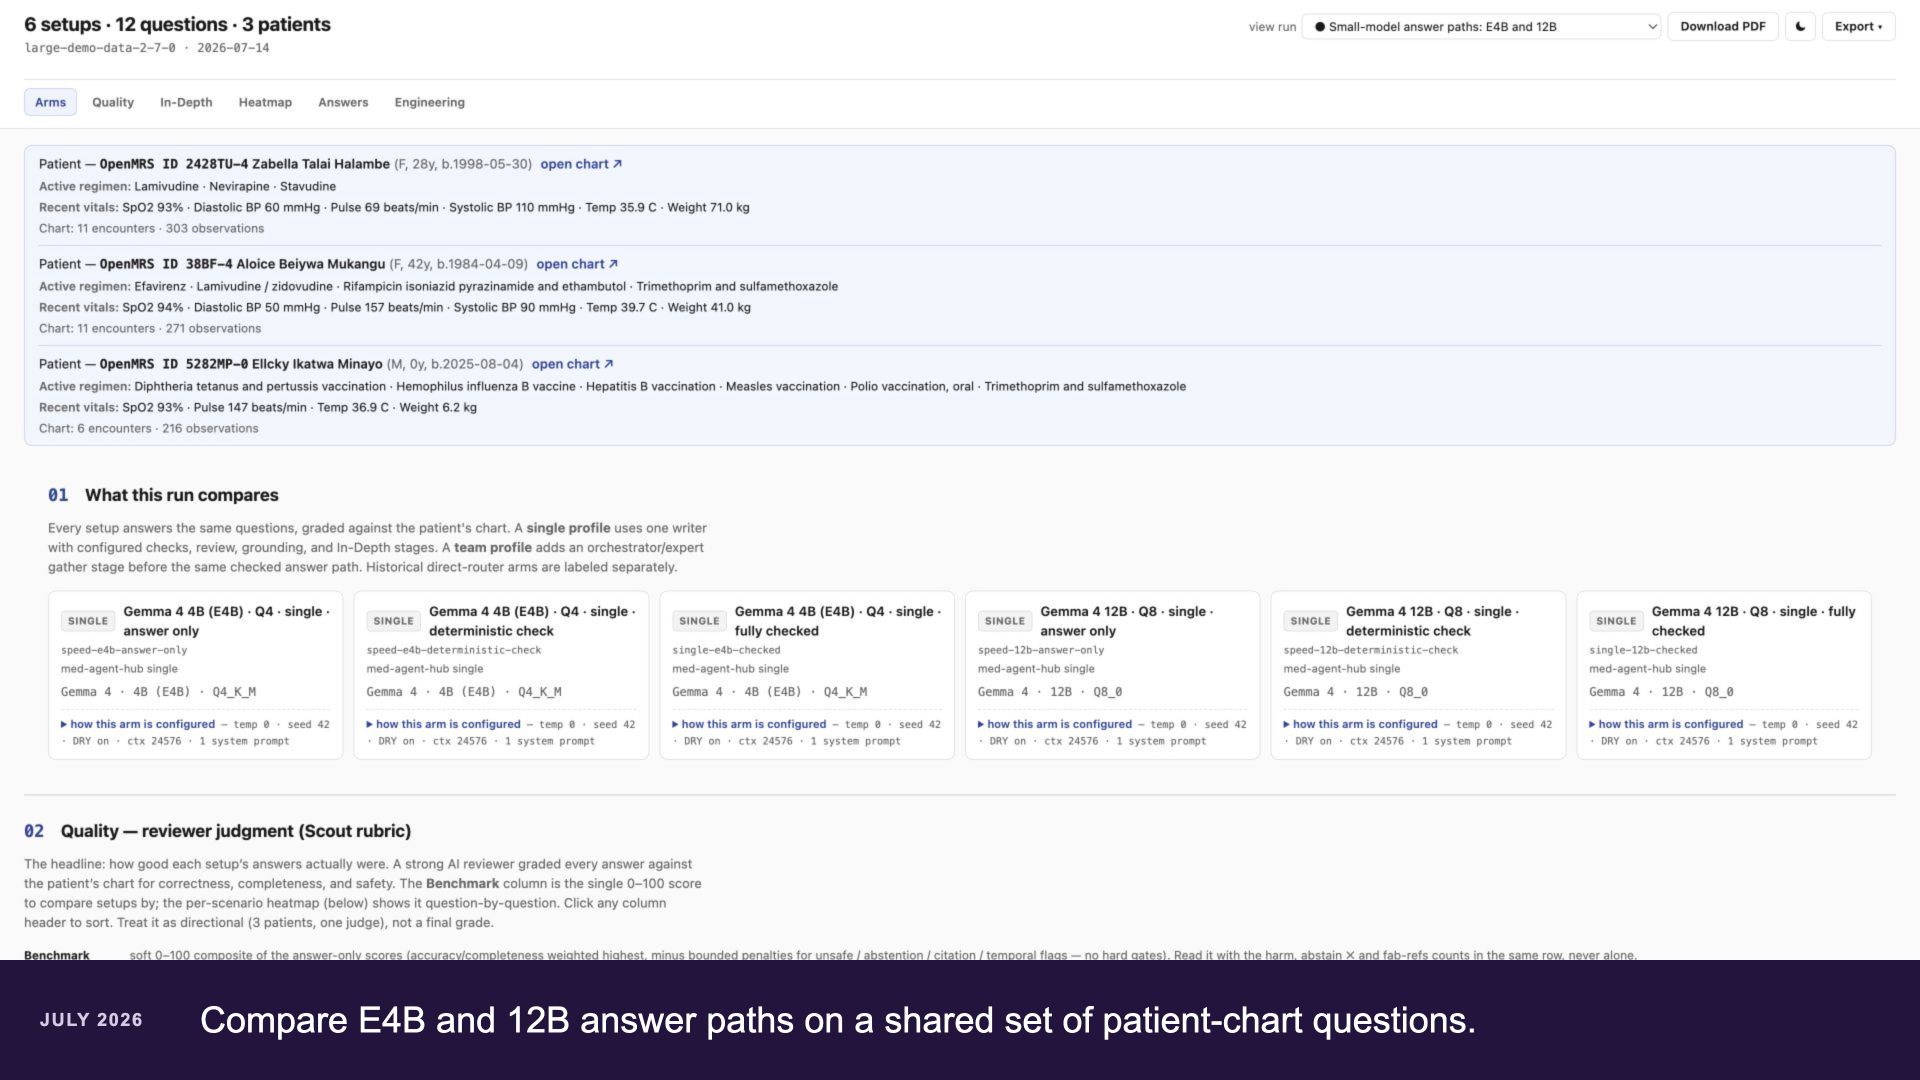
Compare answer paths
The AI engine can support many clinical and health scenarios that may benefit from AI-based inference. This example compares E4B and 12B answer paths on a shared set of patient-chart questions.
Review quality findings
Read accuracy and completeness scores alongside safety findings and the number of questions reviewed.
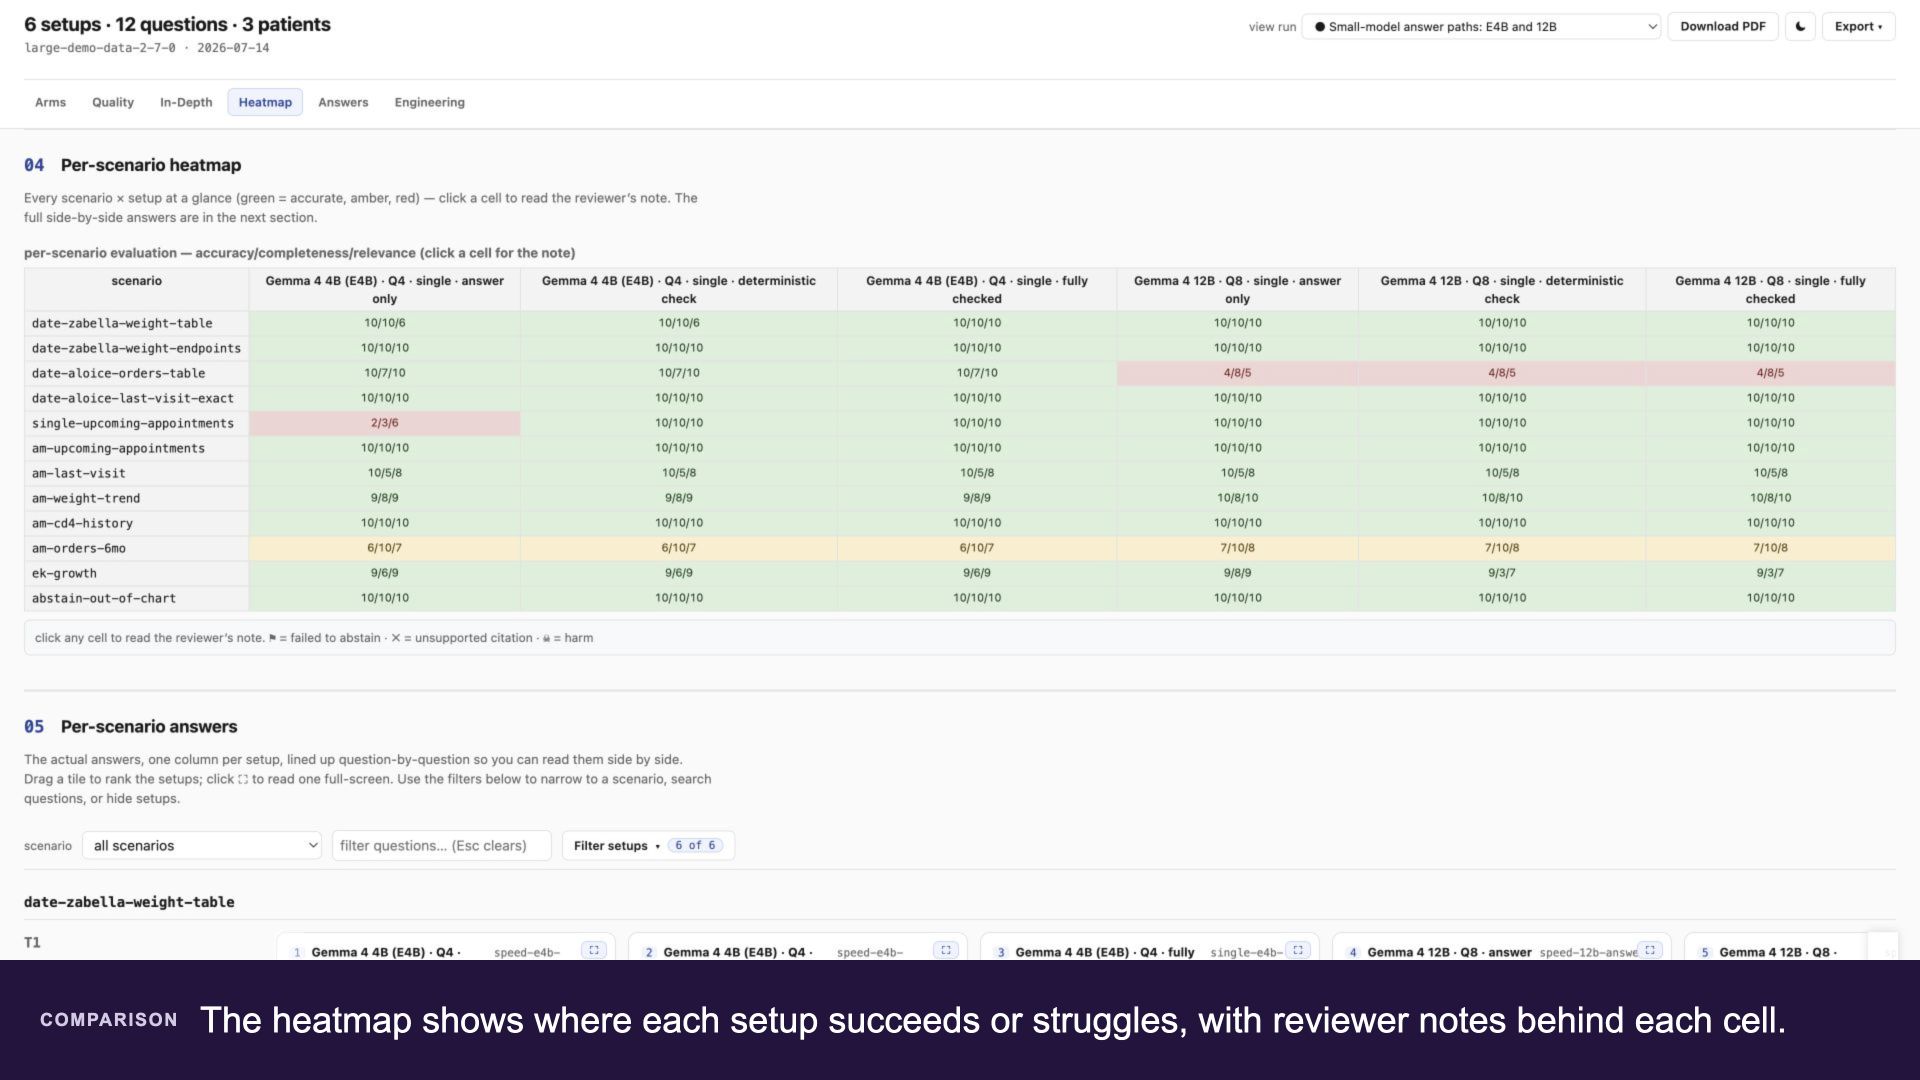
Find differences between scenarios
The heatmap shows where each setup succeeds or struggles, with reviewer notes behind each cell.
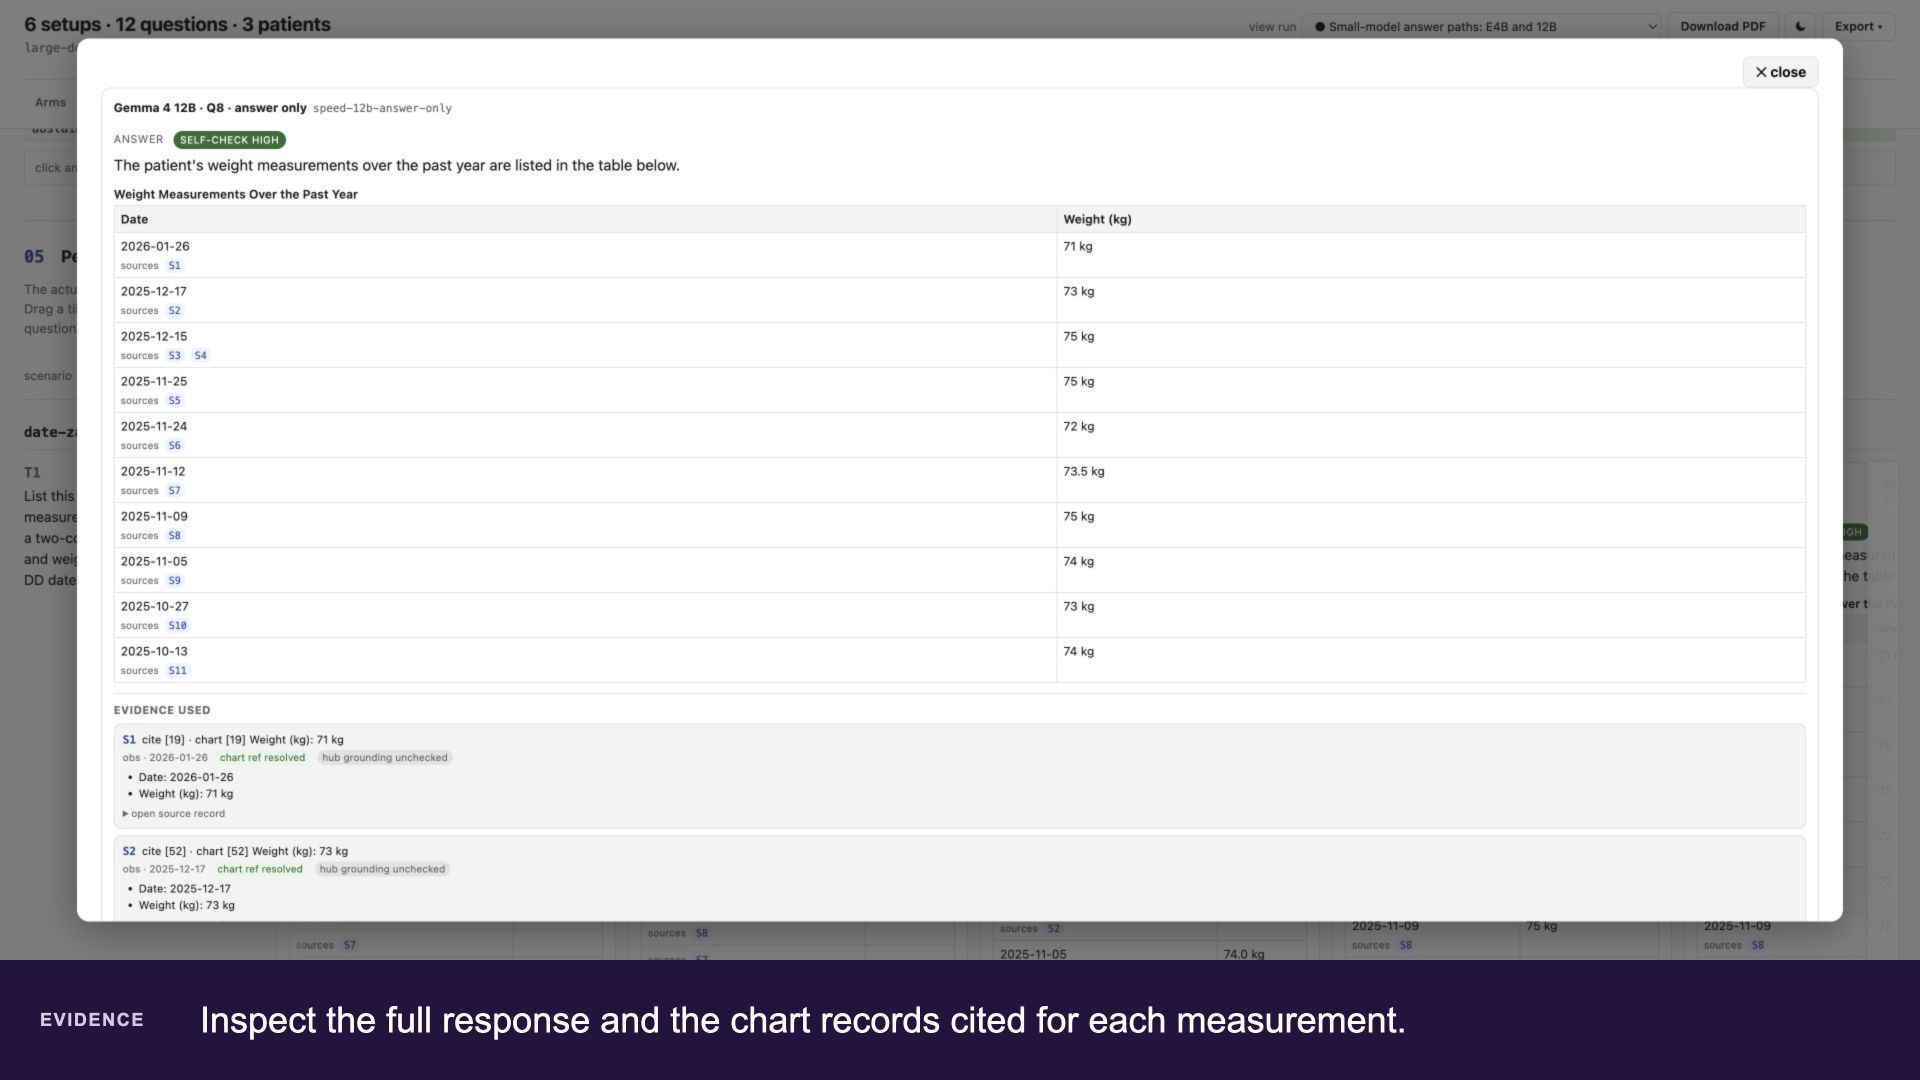
Follow an answer to its sources
Inspect the full response and the chart records cited for each measurement.
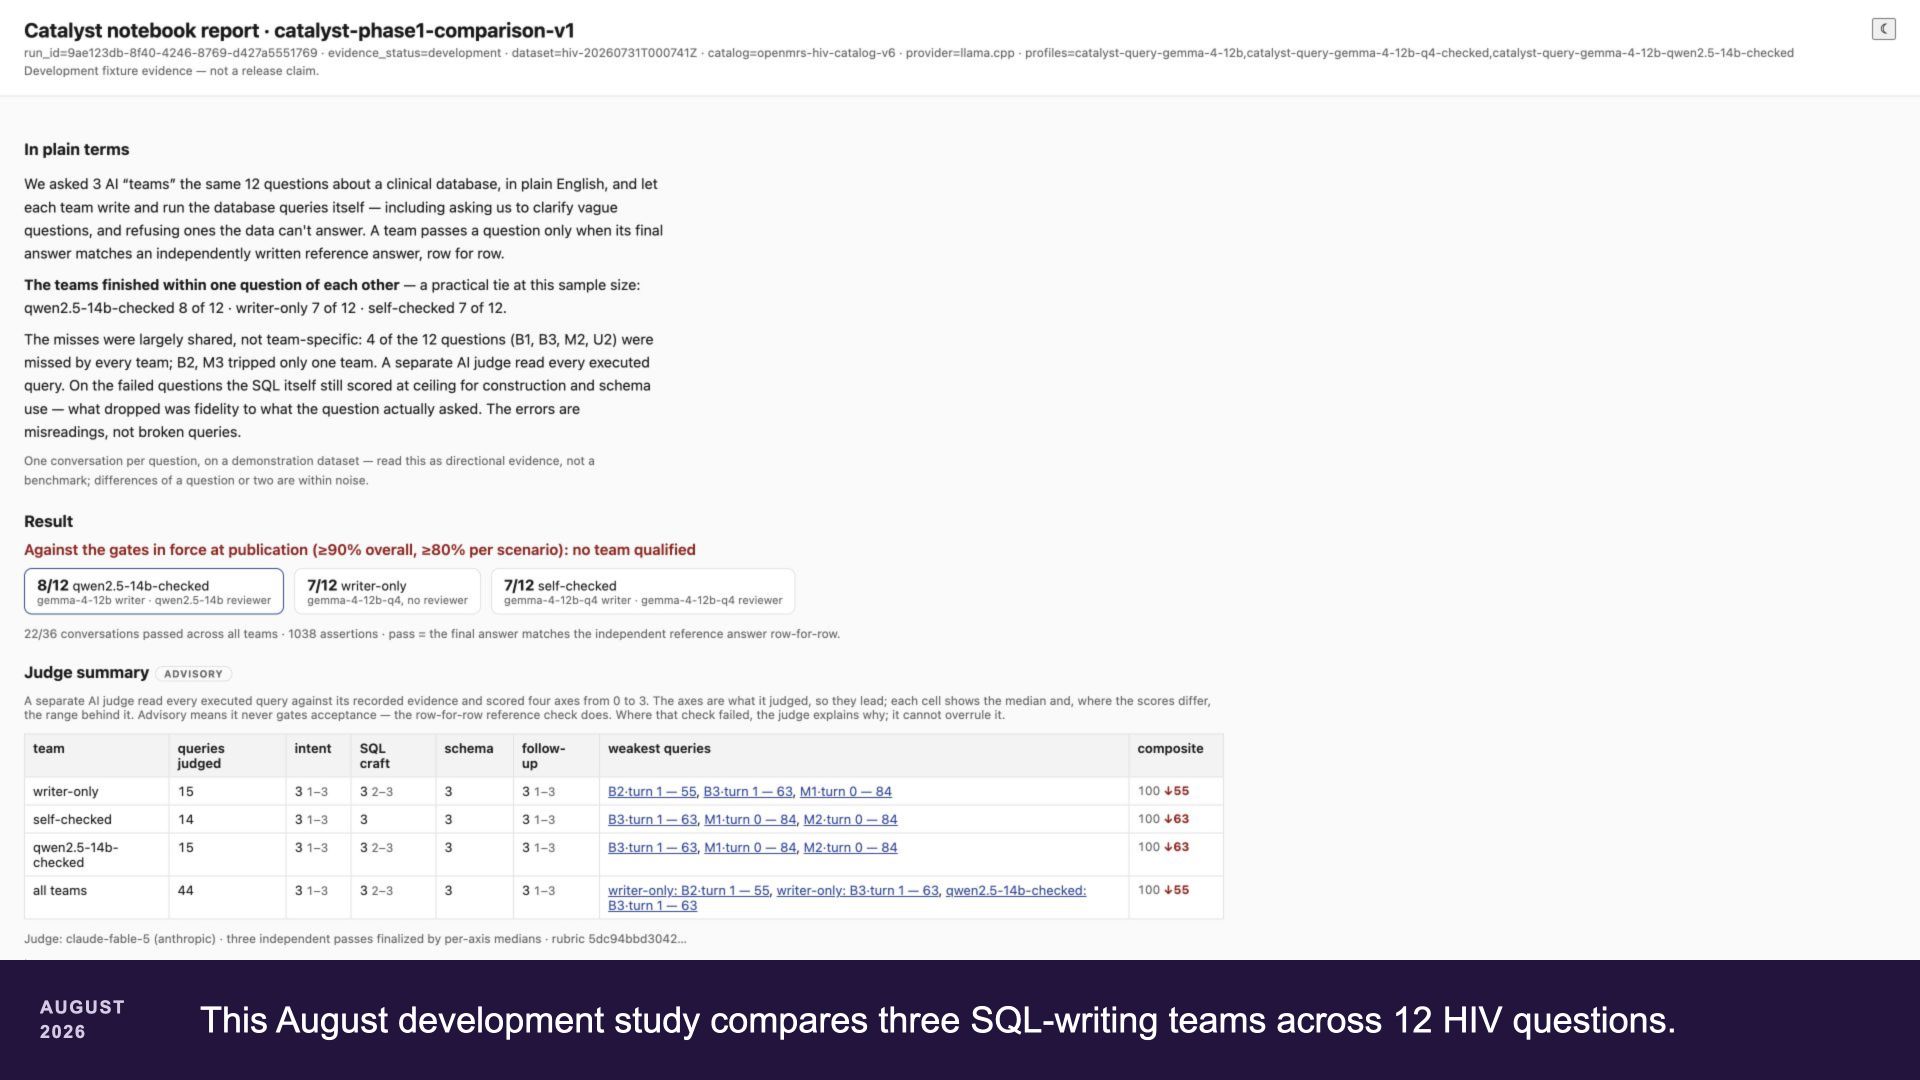
Inspect a historical Catalyst comparison
This August development study compares three SQL-writing teams across 12 HIV questions.
Trace Catalyst findings to each scenario
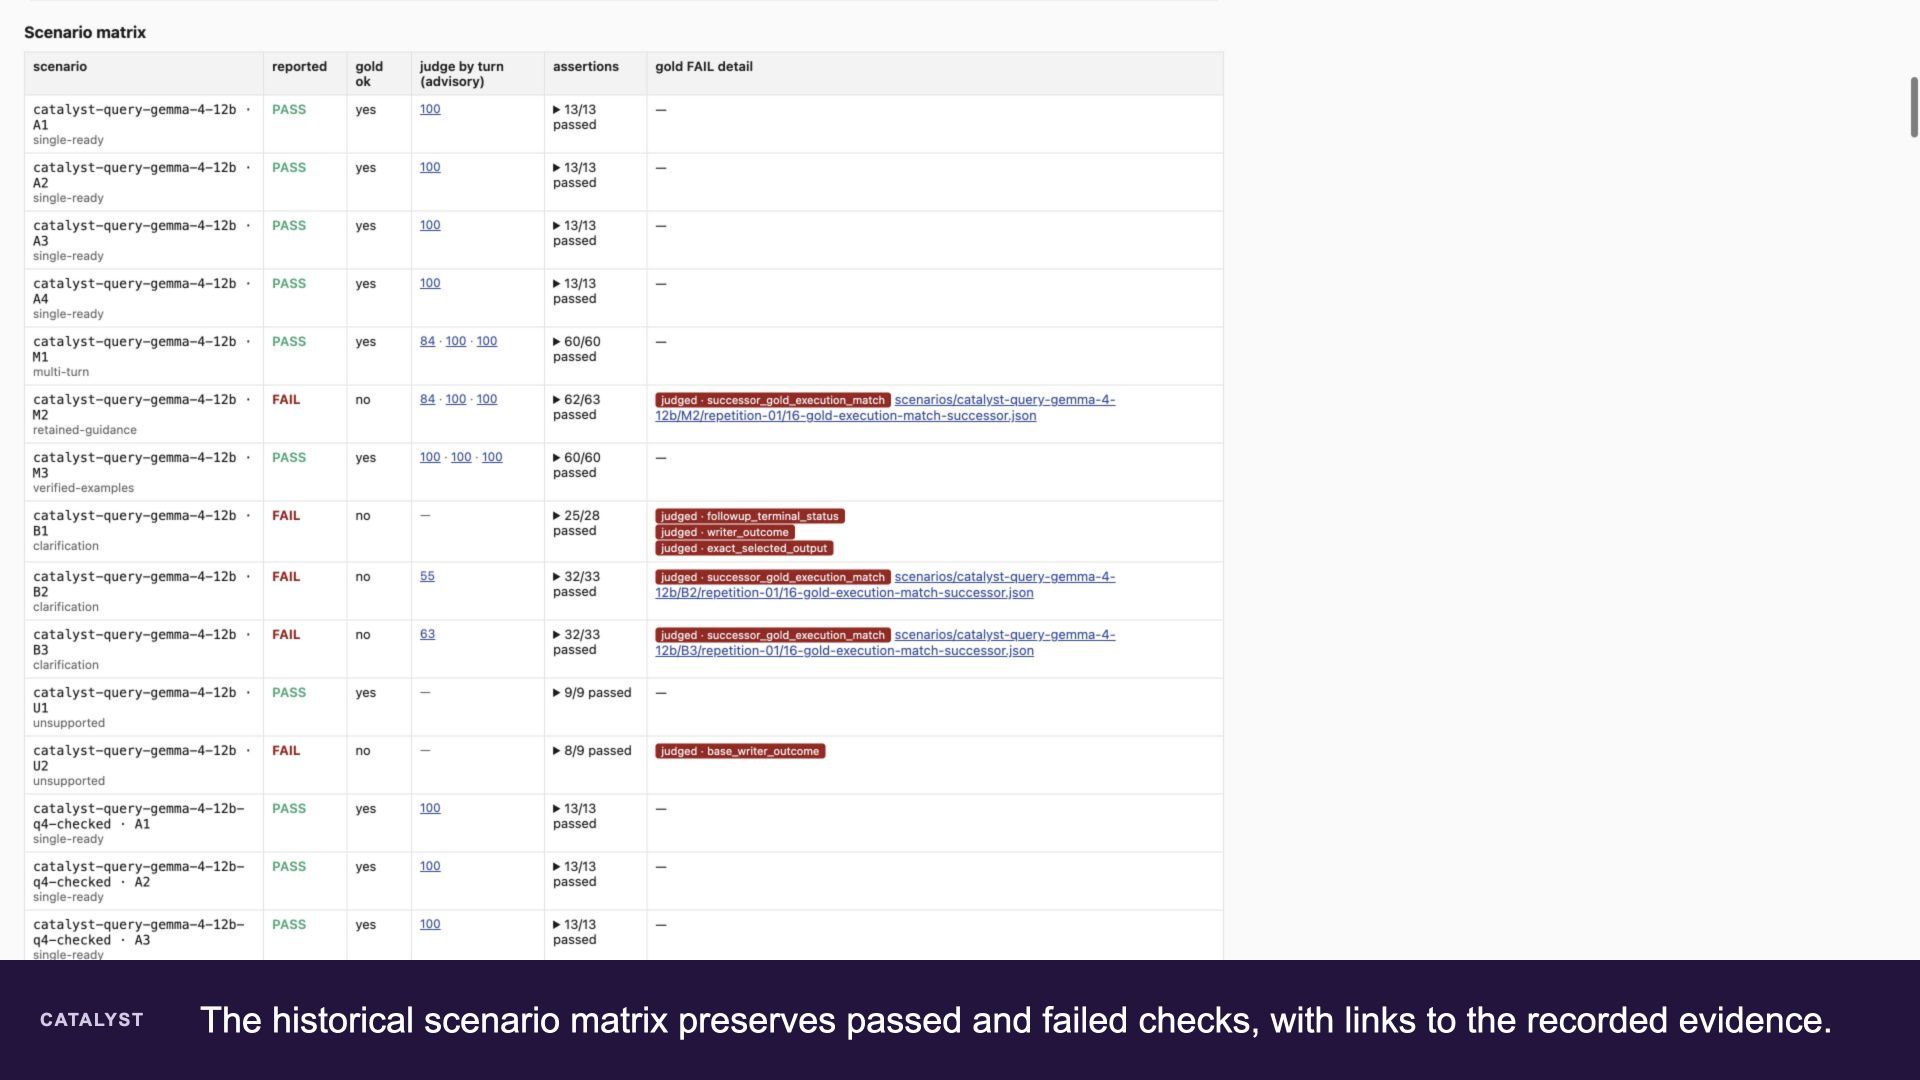
The historical scenario matrix preserves passed and failed checks, with links to the recorded evidence.