Catalyst

Build reports from clinical and program data.

Explore clinical and program data, review the work and turn the results into saved tables, charts and dashboards. Start with a connected source or bring a CSV.

A step-by-step illustrated example: ask, refine, correct and publish using HIV demo data.
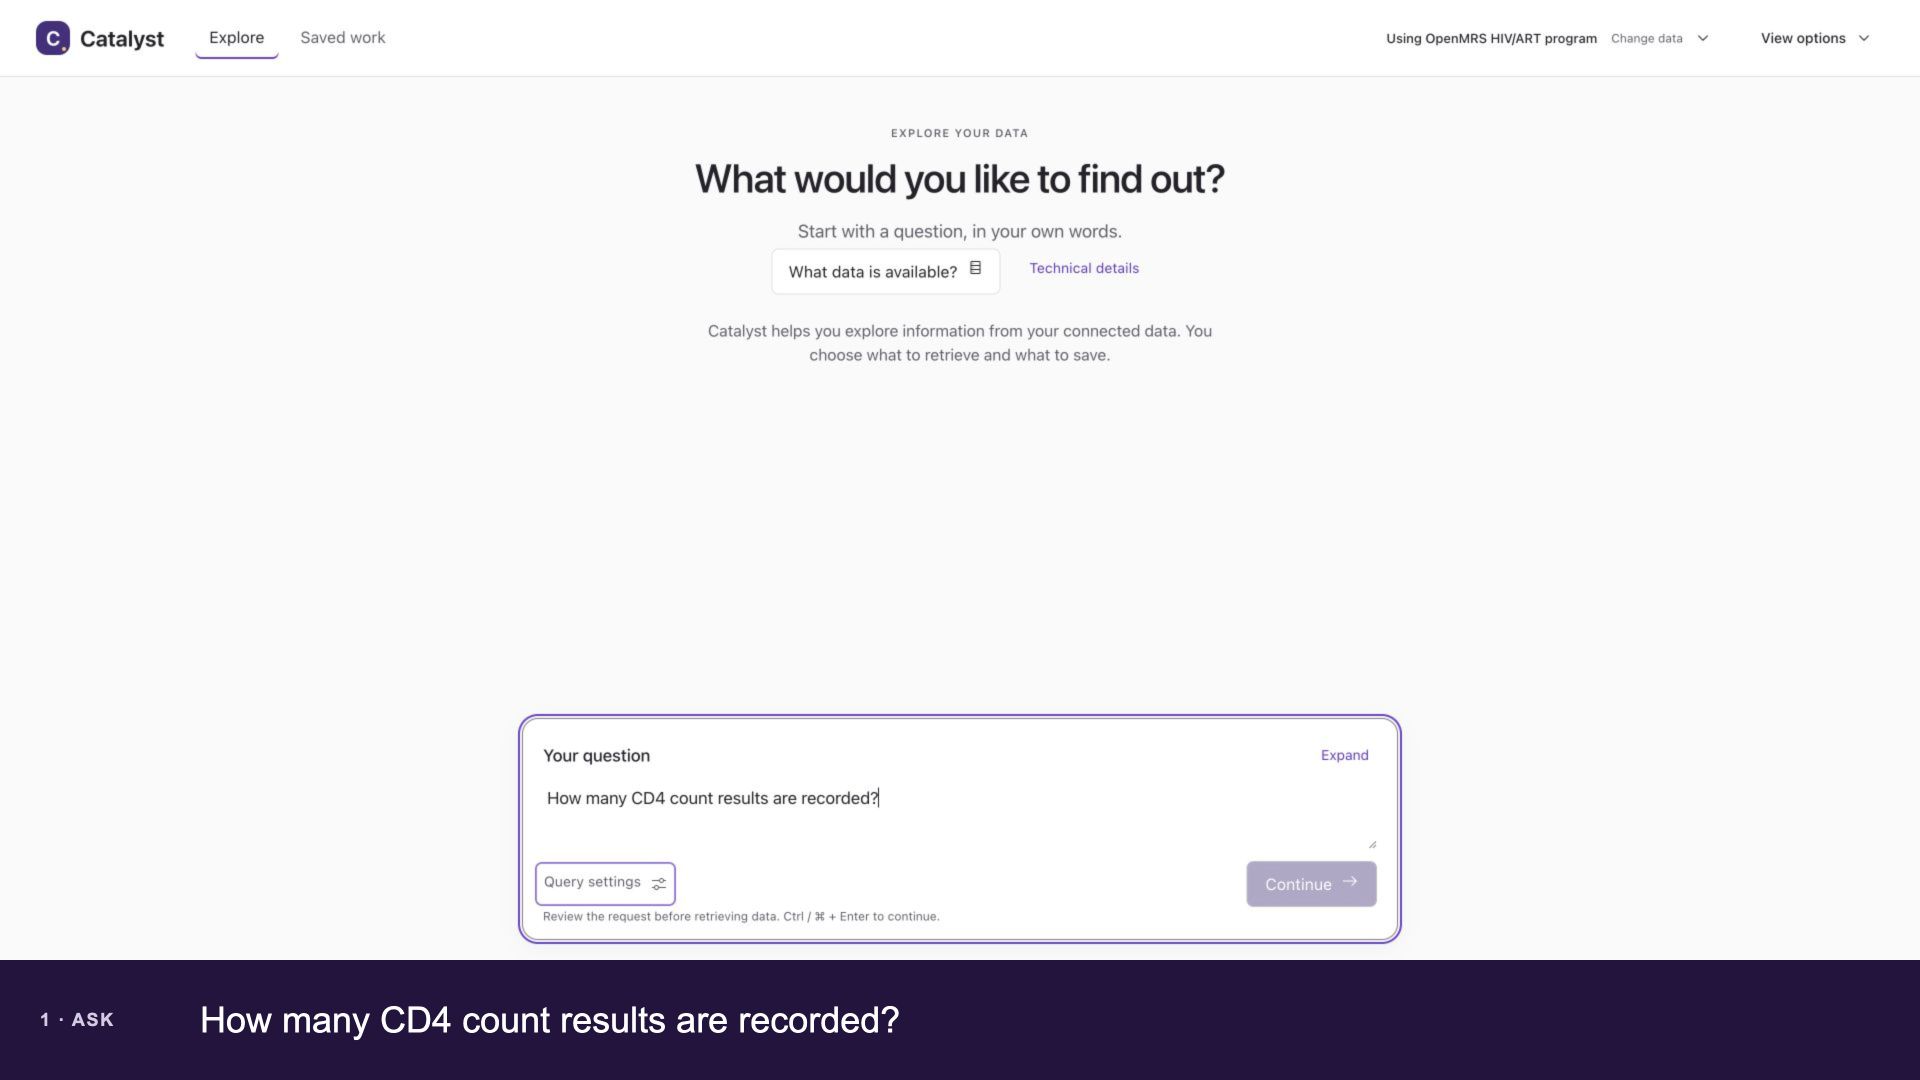
Catalyst Explore page with a question ready to prepare
The Workbench: ask, review and choose what to run.

Working with data in Catalyst

01

Start with your data

Browse a connected source and ask a question, or import a CSV and review its columns.

02

Review and refine

Inspect results and correct SQL when needed. AI suggestions are advisory; you choose when a query runs.

03

Save and share

Save a Dataset, build charts and tables, arrange a dashboard and publish it to Superset.

OpenELIS reporting

OpenELIS reporting pathways

Four complementary paths connect native reporting, CSV imports, direct database queries and FHIR-derived data to dashboards.

Four reviewed local demonstrations and their separately verified server dashboards are available. Owner acceptance remains open.

Explore the four reporting paths

Recorded examples · Local deployments

Catalyst: from a question to a dashboard.

Ask a question, review the proposed query, and turn its results into saved tables, charts and dashboards. The earlier local walkthroughs below use OpenELIS laboratory data and OpenMRS HIV data. Gemma 4 12B drafts each query and Qwen 2.5 14B reviews it; their findings are advisory, and you choose when to run the query. FHIR Data Pipes prepares the source data for the Spark SQL warehouse. The walkthroughs focus on the work you do in Catalyst.

Earlier Catalyst walkthroughs

These earlier recordings show local query-to-dashboard journeys. The new four-pathway demonstrations remain a separate delivery checkpoint.

OpenELIS laboratory data Explore laboratory patient counts and review the breakdown by gender. Earlier walkthrough on YouTube
3:04 · recorded locally · silent
Transcript (silent recording)
  1. FHIR Data Pipes prepares the source data for Spark SQL; this walkthrough was recorded against the local deployment.
  2. Write a question, expand the writing area and browse the available tables and fields without losing the draft.
  3. Gemma 4 12B writes the query and Qwen 2.5 14B reviews it. Preparing the draft does not retrieve results: choose Get results to run it.
  4. Inspect the result and its technical details, then ask for a breakdown by gender, including missing gender.
  5. Save the successful query and reuse its exact SQL while preserving the unfinished question. Advanced mode keeps technical tools accessible while the walkthrough stays in light appearance.
  6. In one brief repair example, the model fixes supplied broken SQL; run the repaired query and preserve the saved original.
  7. Create a table and chart, arrange them on a Dashboard and reopen the saved arrangement.
  8. Publish to Superset, inspect the actual import receipt and compare the rendered table with the originating Catalyst result.
OpenMRS HIV data Explore 2026 CD4 monitoring results by month, then refine the report by gender. Browse the screenshot walkthrough Earlier walkthrough on YouTube
3:56 · recorded locally · silent
Transcript (silent recording)
  1. FHIR Data Pipes prepares the source for Spark SQL; this walkthrough focuses on questions and saved reports in the local deployment.
  2. Write a question, expand the writing area and browse the available tables and fields without losing the draft.
  3. Gemma 4 12B writes the query and Qwen 2.5 14B reviews it. Preparing the draft does not retrieve results: choose Get results to run it.
  4. Inspect monthly CD4 count results and their technical details, then ask for a 2026 breakdown by gender, including missing gender.
  5. Save the successful query and reuse its exact SQL while preserving the unfinished question. Advanced mode keeps technical tools accessible while the walkthrough stays in light appearance.
  6. Keep the model-created SQL and create a monthly line chart with a separate series for each gender.
  7. Create a table and chart, arrange them on a Dashboard and reopen the saved arrangement.
  8. Publish to Superset, inspect the actual import receipt and compare the rendered table with the originating Catalyst result.
01 Selected source contract

A configured SQL source exposes its complete readable schema: source identity, SQL dialect, and every readable table and column.

02 Selected execution contract

Findings are advisory. The exact selected SQL runs once and returns typed rows or the database error.

03 Implementation status

The current Workbench is deployed locally and on the demo server. These videos show local validation; final four-pathway server validation and owner acceptance remain open. Model-team comparison is separately scheduled.

Catalyst pipeline

How each query is produced.

Catalyst Gateway owns source context, query versions, optional writer/reviewer composition, advisory findings, and execution. It calls Med Agent Hub only to run configured model roles. The four stages below are the lifecycle shown in both local recordings.

1 Draft

A writer model drafts SQL from the source context supplied by the current runtime.

2 Review

When selected, a reviewer model checks the draft against the same question and schema.

3 Inspect

The person can edit the query and inspect advisory findings without losing the draft.

4 Execute

The exact selected query runs through the configured source and returns rows or its database error.

Guides and source code